
By RoboForex Analytical Department
The USD/JPY currency pair has climbed to a three-month high of 154.87, driven by the strengthening US dollar following Donald Trump’s election victory. Markets anticipate that Trump’s protectionist policies, which are expected to bolster the US economy, might also fuel inflation, prompting the Federal Reserve to maintain higher interest rates than previously anticipated.
In Japan, producer prices rose at their fastest pace in 14 months in October, signalling persistent inflation pressures. Attention is shifting towards Japan’s GDP data for Q3 2024, set to be released on Friday, which will provide further insight into the economic trends affecting the yen.
The Bank of Japan is under scrutiny as it contemplates an interest rate increase to 1% per annum during the first half of fiscal 2025. However, Japanese monetary authorities remain cautious, considering the external economic factors and the challenges posed by persistent inflation.
Technical analysis of USD/JPY
Free Reports:
 Get our Weekly Commitment of Traders Reports - See where the biggest traders (Hedge Funds and Commercial Hedgers) are positioned in the futures markets on a weekly basis.
 Sign Up for Our Stock Market Newsletter – Get updated on News, Charts & Rankings of Public Companies when you join our Stocks Newsletter
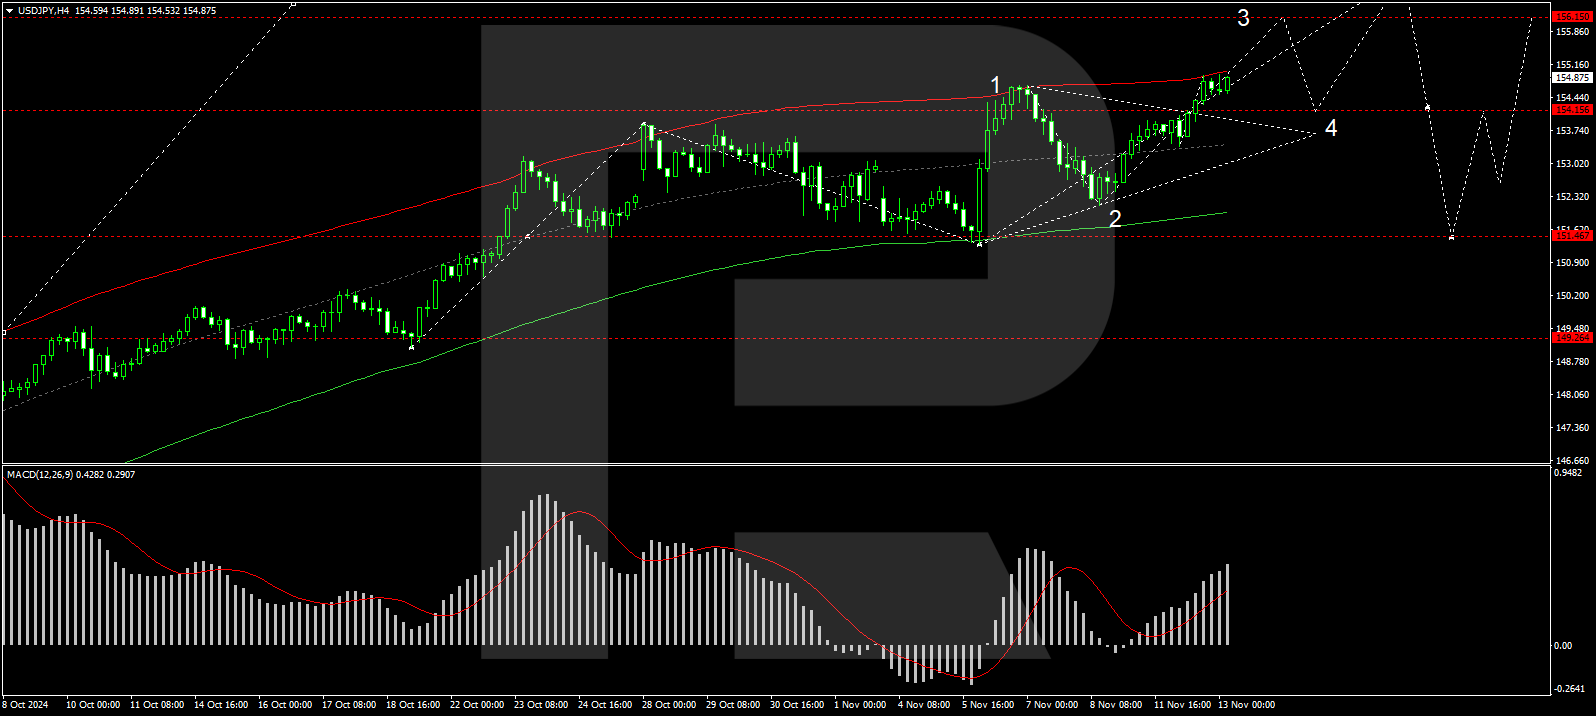
On the H4 USD/JPY chart, the market continues developing the third wave of growth to the level of 156.15. After reaching this level, we will consider the probability of the start of correction to the level of 154.15. Further, we expect the beginning of a new wave of growth to the level of 157.00. Technically, this scenario is confirmed by the MACD indicator. Its signal line is above the zero level and is directed upwards.
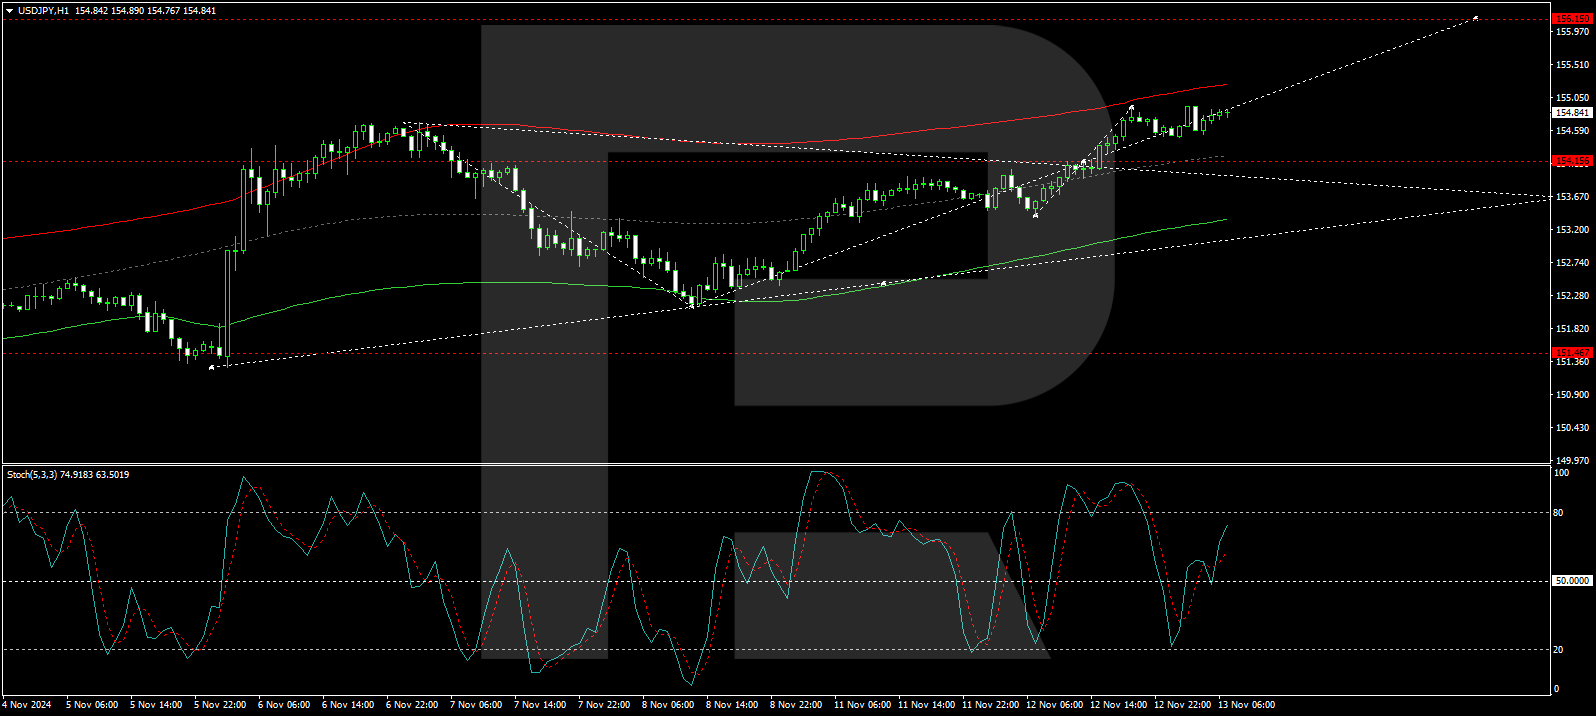
On the H1 USD/JPY chart, the market has formed a consolidation range around the 154.15 level and continues developing the wave to 156.15 with an upward exit. After reaching this level, we expect a correction towards 154.15, initially targeting 155.20. Technically, this scenario is confirmed by the Stochastic oscillator. Its signal line is above the level of 50 and is directed upwards.
Disclaimer
Any forecasts contained herein are based on the author’s particular opinion. This analysis may not be treated as trading advice. RoboForex bears no responsibility for trading results based on trading recommendations and reviews contained herein.

- COT Metals Charts: Speculator Bets led by Silver, Gold & Platinum Mar 7, 2026
- COT Bonds Charts: Speculator Bets led by 10-Year Bonds & Fed Funds Mar 7, 2026
- COT Energy Charts: Speculator Bets led by Brent Oil & Heating Oil Mar 7, 2026
- COT Soft Commodities Charts: Speculator Bets led by Corn & Soybean Meal Mar 7, 2026
- Investors run to safe-haven assets amid Middle East escalation Mar 6, 2026
- EUR/USD Under Pressure: Middle East Risks Outweigh All Else Mar 6, 2026
- Bitcoin shows resilience to Middle East events. Oil market stabilizes Mar 5, 2026
- GBP/USD: Market Not Expecting BoE Rate Cut in March Mar 5, 2026
- Brent headed for $100? Mar 4, 2026
- Global stock indices continue sell-off due to Middle East conflict Mar 4, 2026