
By RoboForex Analytical Department
AUD/USD is showing signs of stabilisation near 0.6465, marking its second consecutive session of attempts to recover.
The Australian dollar finds some support from the hawkish comments made by Reserve Bank of Australia (RBA) Governor Michele Bullock. Bullock stated that interest rates are restrictive and will remain so until the RBA is fully assured of the inflation outlook.
Investors are keenly awaiting the publication of the minutes from the last RBA meeting, which is expected this week. The minutes will provide deeper insights into the RBA’s future policy actions.
Additionally, upcoming releases on November’s industrial and services sector data could further influence the Australian dollar’s trajectory.
Despite these supportive factors, AUD/USD remains near three-month lows, pressured by a strengthening US dollar. The US dollar has benefited from expectations that the Federal Reserve might opt for a more minor rate cut amid robust economic forecasts under President Donald Trump’s administration.
Free Reports:
 Download Our Metatrader 4 Indicators – Put Our Free MetaTrader 4 Custom Indicators on your charts when you join our Weekly Newsletter
 Get our Weekly Commitment of Traders Reports - See where the biggest traders (Hedge Funds and Commercial Hedgers) are positioned in the futures markets on a weekly basis.
Technical analysis of AUD/USD
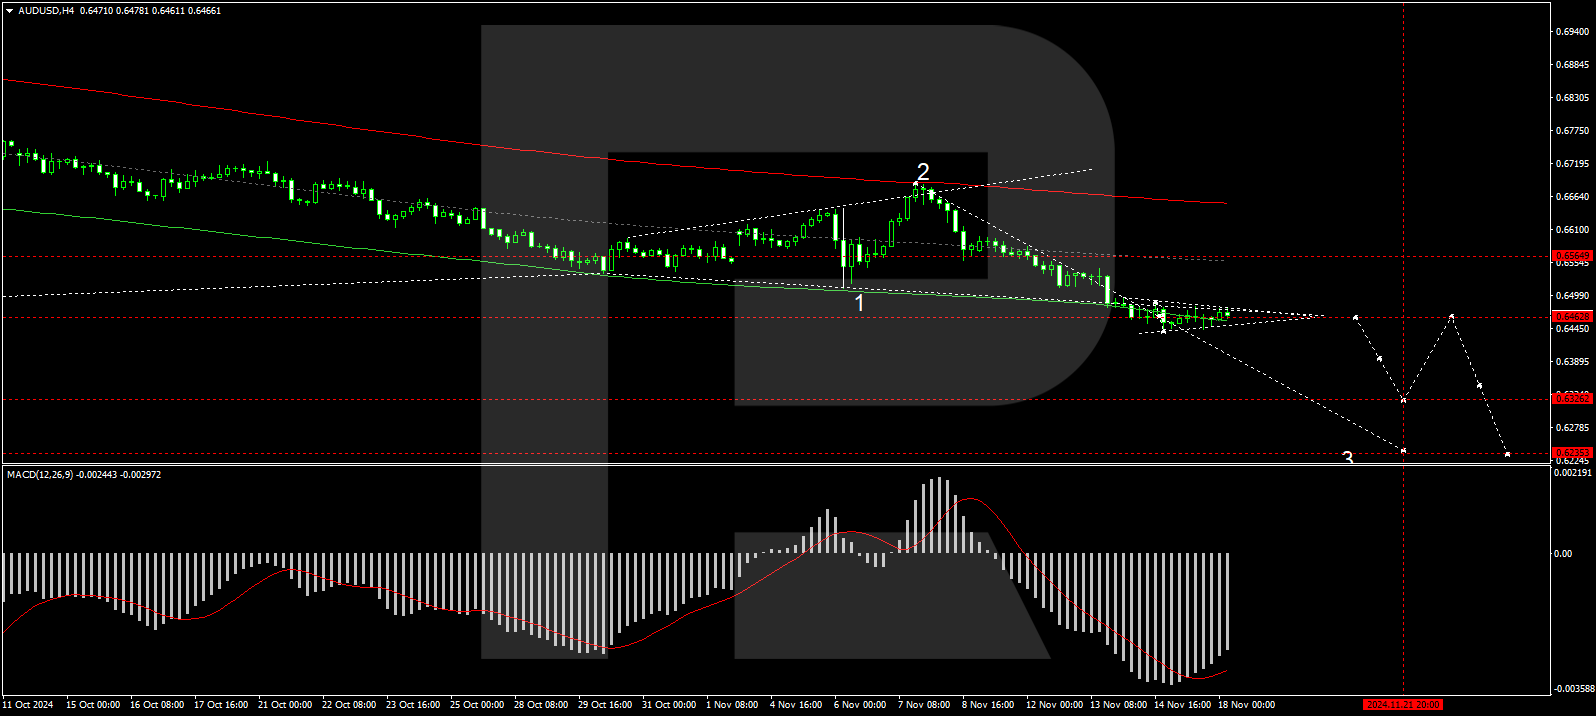
On the H4 chart of AUD/USD, the market has formed a broad consolidation range around the 0.6565 level. Currently, the market has broken through the lower boundary of this range. Today, a narrower consolidation range has developed around the 0.6464 level. It is relevant to consider the probability of a downward breakout from this range, which could lead to a further downward movement towards the 0.6333 level, with the potential for the trend to continue to 0.6233, the local target. Technically, this scenario is supported by the MACD indicator, as its signal line is below zero and pointing downwards.
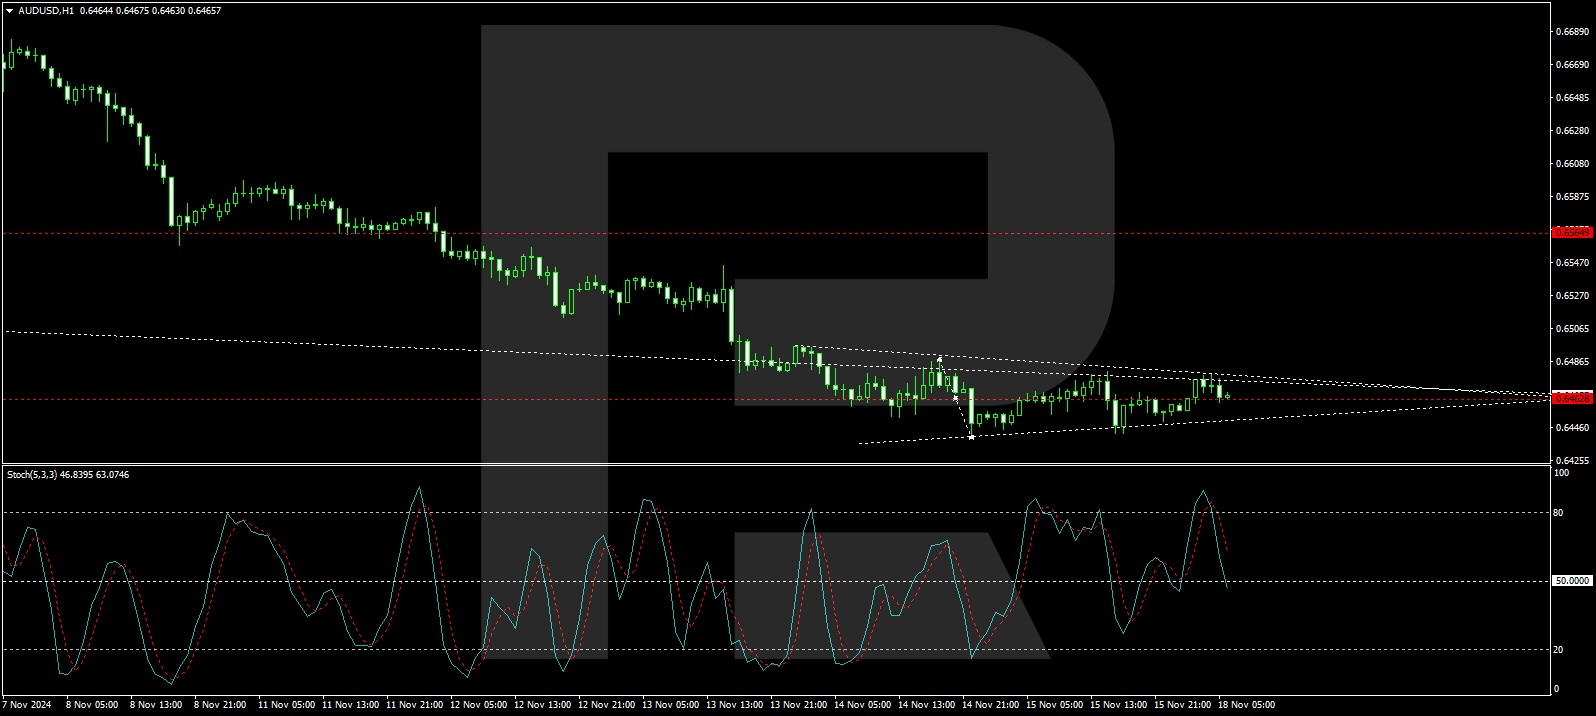
On the H1 AUD/USD chart, the market continues to form a narrow consolidation range around 0.6464. In case of a downside breakout, we anticipate the second half of the downward wave continuing, targeting 0.6333. Conversely, a corrective move towards 0.6500 is possible if the market breaks upwards. The downward trend is expected to extend towards 0.6233 in the longer term. Technically, this scenario is supported by the Stochastic oscillator, with its signal line positioned below the 80 mark and pointing down towards 20.
Disclaimer
Any forecasts contained herein are based on the author’s particular opinion. This analysis may not be treated as trading advice. RoboForex bears no responsibility for trading results based on trading recommendations and reviews contained herein.

- Investors run to safe-haven assets amid Middle East escalation Mar 6, 2026
- EUR/USD Under Pressure: Middle East Risks Outweigh All Else Mar 6, 2026
- Bitcoin shows resilience to Middle East events. Oil market stabilizes Mar 5, 2026
- GBP/USD: Market Not Expecting BoE Rate Cut in March Mar 5, 2026
- Brent headed for $100? Mar 4, 2026
- Global stock indices continue sell-off due to Middle East conflict Mar 4, 2026
- USD/JPY to Quickly Return to Growth: Momentum Favours the US Dollar Mar 4, 2026
- European equities plunge amid Persian Gulf military conflict Mar 3, 2026
- Gold Rallies for Fifth Day, With External Risks Mounting Mar 3, 2026
- Iran Crisis: A Dangerous Turning Point Mar 2, 2026