
By RoboForex Analytical Department
The AUD/USD pair is experiencing upward momentum for the second consecutive day, reaching a one-week high near 0.6453 on Tuesday. This positive movement comes after a period of rapid decline and is supported by encouraging economic data from Australia.
The latest manufacturing PMI report for April significantly contributed to the Australian dollar’s appreciation. It showed an increase to 49.9 points, up from 47.3 the previous month. This improvement brings the manufacturing sector close to the critical 50.0 threshold, distinguishing between the industry’s growth and contraction. Additionally, the services PMI reported the most robust expansion in the last three months, and the private sector experienced its fastest growth in two years during April.
These robust economic reports not only indicate a resilient economy but also carry pro-inflationary implications. They bolster the outlook that the Reserve Bank of Australia (RBA) may maintain higher interest rates for an extended period to manage inflationary pressures effectively.
Investors will also pay attention to the upcoming release of inflation statistics later in the week, which will provide further insights into the economic factors influencing the RBA’s monetary policy decisions.
Moreover, the Australian dollar’s gains were further supported by a reduction in investor concerns over geopolitical risks in the Middle East, contributing to a more favourable risk environment.
Free Reports:
 Get our Weekly Commitment of Traders Reports - See where the biggest traders (Hedge Funds and Commercial Hedgers) are positioned in the futures markets on a weekly basis.
 Download Our Metatrader 4 Indicators – Put Our Free MetaTrader 4 Custom Indicators on your charts when you join our Weekly Newsletter
Technical analysis of AUD/USD
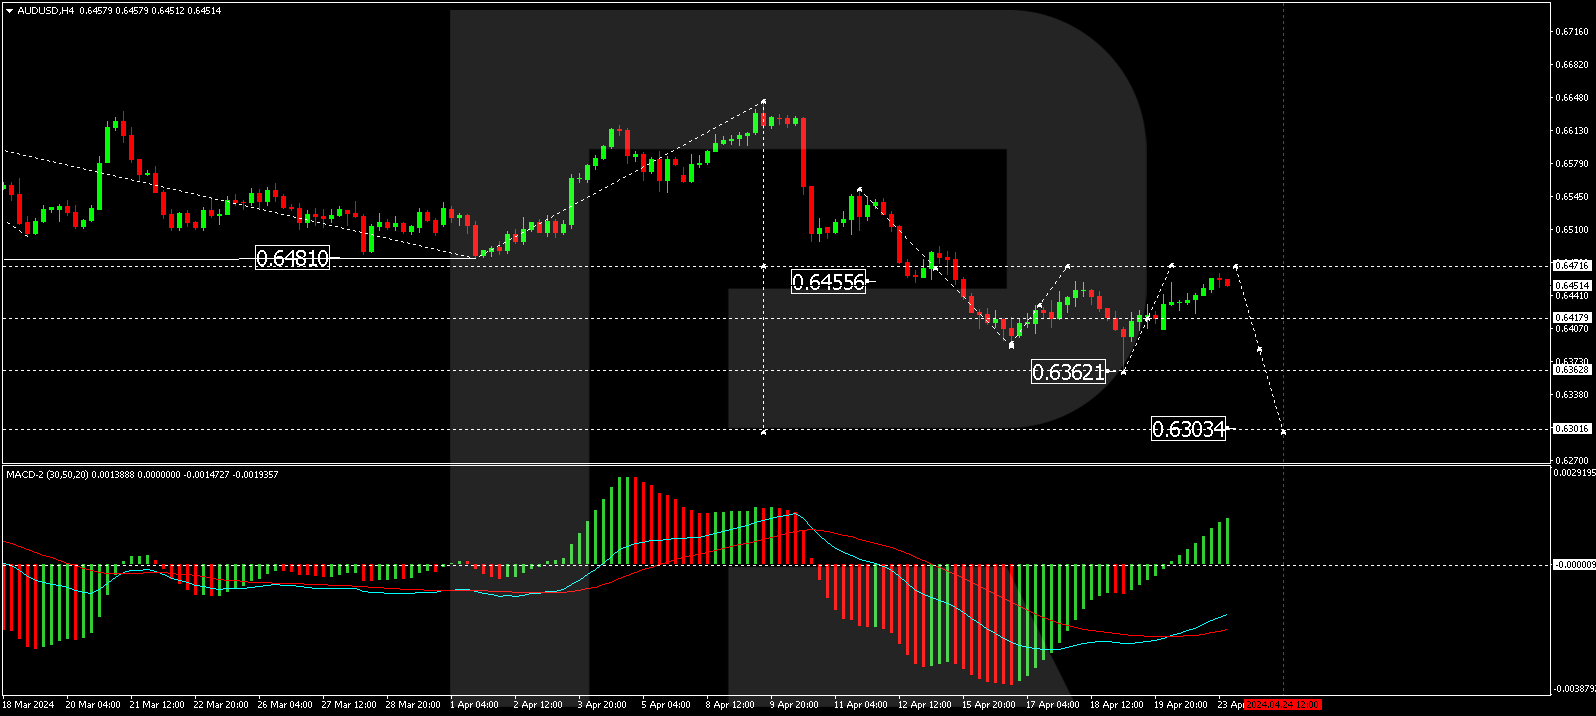
On the H4 chart, the AUD/USD pair completed a declining wave to 0.6362. A corrective movement towards 0.6471 is underway. Upon completion of this correction, a continuation of the downward trend towards 0.6300 is anticipated. The MACD indicator supports this bearish outlook despite its signal line being above zero, which typically suggests growth potential.
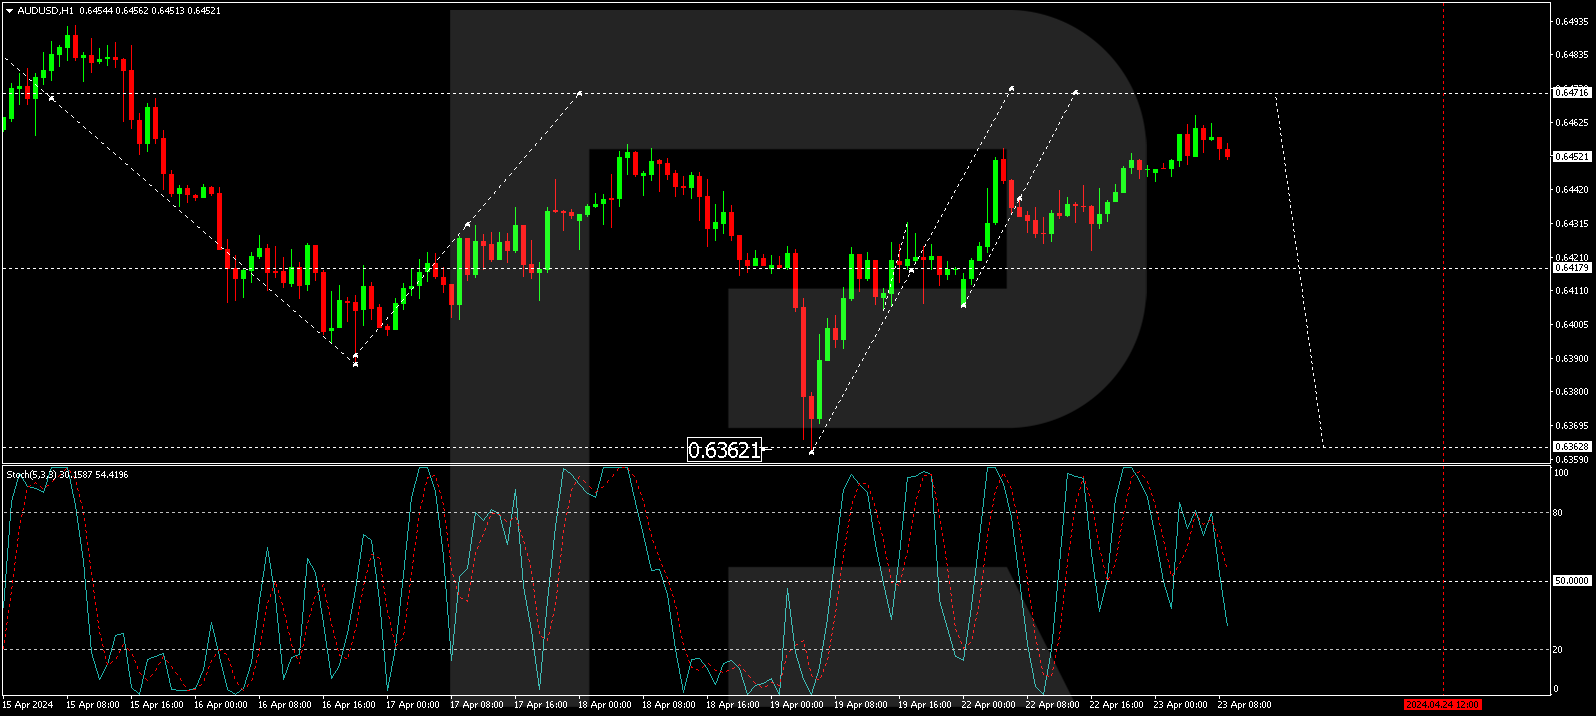
On the H1 chart, a consolidation range has been formed around 0.6417. A breakout above this range could lead to a rise towards 0.6471. Following this peak, a new downward wave to 0.6363 is expected. Breaking below this level may pave the way to reach 0.6300. The Stochastic oscillator, with its signal line currently below 80 and pointing downwards, confirms this potential downward trajectory.
Disclaimer
Any forecasts contained herein are based on the author’s particular opinion. This analysis may not be treated as trading advice. RoboForex bears no responsibility for trading results based on trading recommendations and reviews contained herein.

- Investors run to safe-haven assets amid Middle East escalation Mar 6, 2026
- EUR/USD Under Pressure: Middle East Risks Outweigh All Else Mar 6, 2026
- Bitcoin shows resilience to Middle East events. Oil market stabilizes Mar 5, 2026
- GBP/USD: Market Not Expecting BoE Rate Cut in March Mar 5, 2026
- Brent headed for $100? Mar 4, 2026
- Global stock indices continue sell-off due to Middle East conflict Mar 4, 2026
- USD/JPY to Quickly Return to Growth: Momentum Favours the US Dollar Mar 4, 2026
- European equities plunge amid Persian Gulf military conflict Mar 3, 2026
- Gold Rallies for Fifth Day, With External Risks Mounting Mar 3, 2026
- Iran Crisis: A Dangerous Turning Point Mar 2, 2026