Technical Analyst Clive Maund reviews Treatment.com AI Inc.’s charts to explain why he believes it is currently a Strong Buy.
Treatment.com AI Inc. (TRUE:CSE; TREIF:OTCMKTS) is a company that should have a very bright future as it has been pioneering the development of an AI healthcare platform using AI and advanced machine learning technologies that has the potential to revolutionize healthcare due to the streamlining of healthcare provision and the massive cost savings across the industry that should result.
The growth potential of this industry is enormous, as is made clear when you consider that the AI healthcare market, which was valued at US$11 billion in 2021, is projected to grow to US$187 billion in 2030, and with Treatment.com AI having already developed its own platform it is centrally placed to be a part of this.
The fields in which AI is set to make a big contribution are Virtual Assistance and Chatbots, Diagnosis and Treatment Planning, Streamlining Administrative Tasks, and Predictive Analytics.
Treatment.com AI’s platform is powered by its proprietary Global Library of Medicine, which incorporates AI machine learning and has been trained by hundreds of physician experts across the globe.
Free Reports:
 Get our Weekly Commitment of Traders Reports - See where the biggest traders (Hedge Funds and Commercial Hedgers) are positioned in the futures markets on a weekly basis.
 Sign Up for Our Stock Market Newsletter – Get updated on News, Charts & Rankings of Public Companies when you join our Stocks Newsletter
The company is already in partnership with the Mayo Clinic and the University of Minnesota Medical School and is in discussion with another 52 organizations.
More details on all these developments are available in the company presentation.
We will now examine a range of charts to determine exactly what is happening with Treatment.com AI stock. These charts reveal clear technical patterns that enable us to see with almost pinpoint accuracy where the stock is in its lifecycle and, therefore, what we can expect to see unfold going forward.
The upside potential from the current historically low level is very substantial, especially in percentage terms.
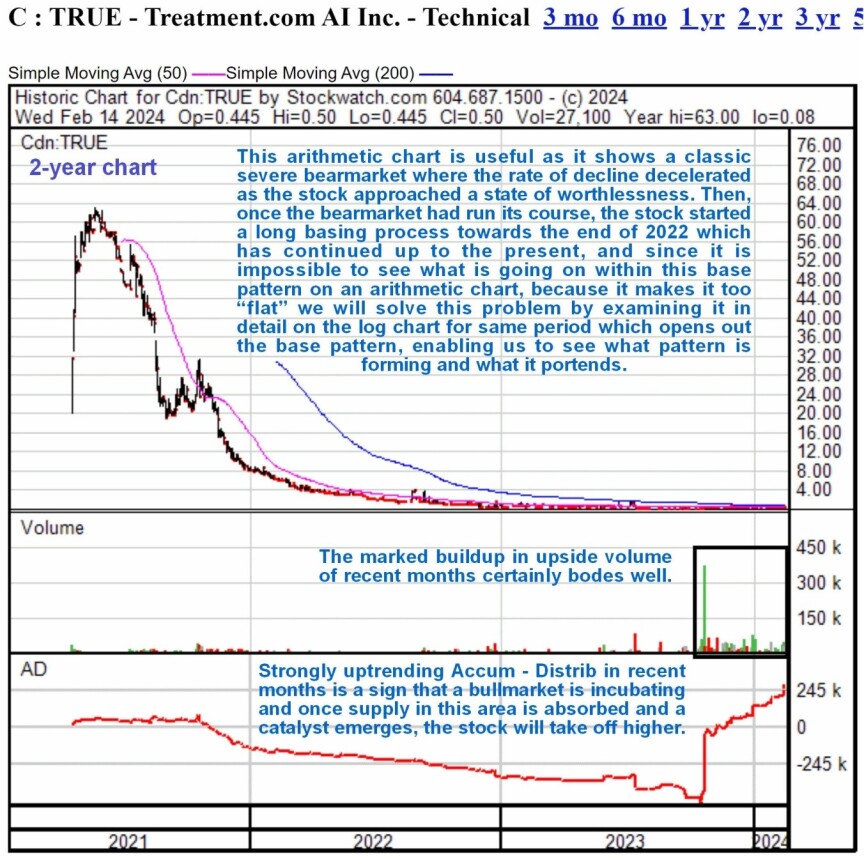
We will start with the 2-year arithmetic chart, which makes brutally clear the severity of the bear market that followed from the peak at almost CA$63 towards the middle of 2021.
This savage bear market resulted in the stock losing well over 99% of its value from that peak. The value of this chart is not just that it clearly shows this bear market in its entirety, but it also shows how the rate of decline decelerated during the second half of 2022 before it settled into a long and very low base pattern that has continued from late 2022 all through 2023 and into this year.
Beyond observing these points, this chart is of little use technically because it squashes the base pattern so flat that we can’t see what is going on within it, but we can solve that problem by means of a log chart for the same timeframe, which we will now proceed to look at, but before leaving this chart to observe how upside volume has expanded quite dramatically since mid-October which has resulted in the Accumulation line shown at the bottom of it trending steeply higher — this is a clear indication of persistent accumulation of the stock presumably by those investors who believe that the company is set to do well and that its stock will, in consequence, enter a bullmarket. These are, therefore, very bullish indications.

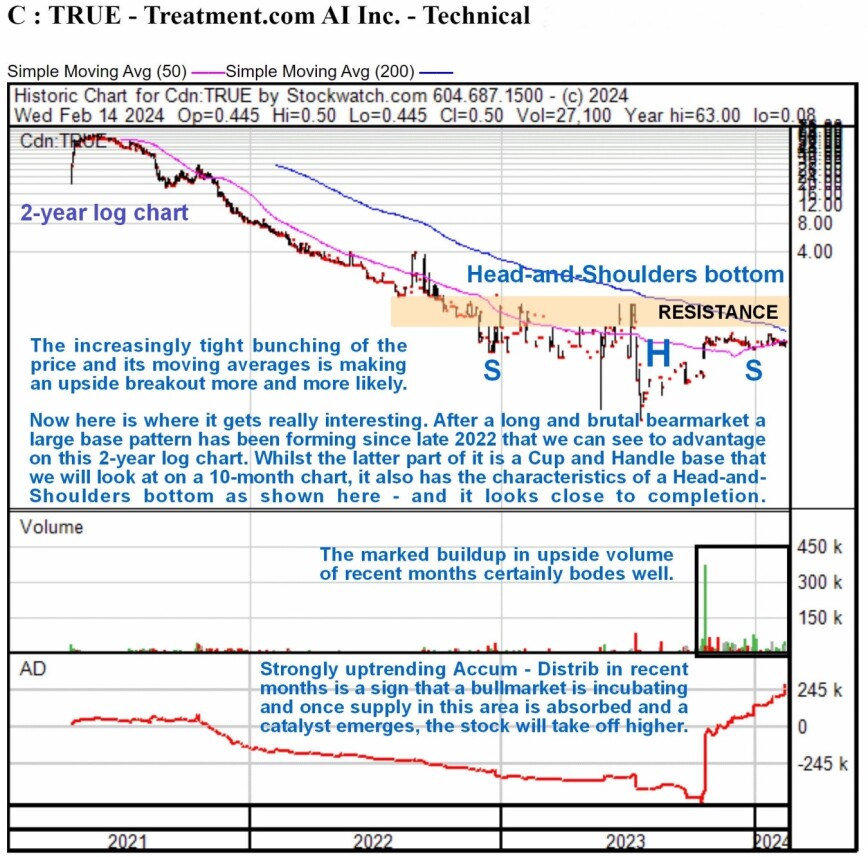
Now, we will look at the 2-year log chart, which looks dramatically different from the arithmetic chart above for the same timeframe, which is due to the fact that the base pattern still in progress has formed at a very low level. This most useful chart makes it possible for us to see exactly what has been going on.
A Head-and-Shoulders pattern has built out whose Left Shoulder formed as far back as late 2022, so 14 months ago. The Right Shoulder of the pattern has been forming for several months now and is not yet complete, but with the price and its moving averages having converged in a most potent manner, we are believed to be fast approaching an upside breakout from this base pattern, especially as the Accumulation line is so strong.

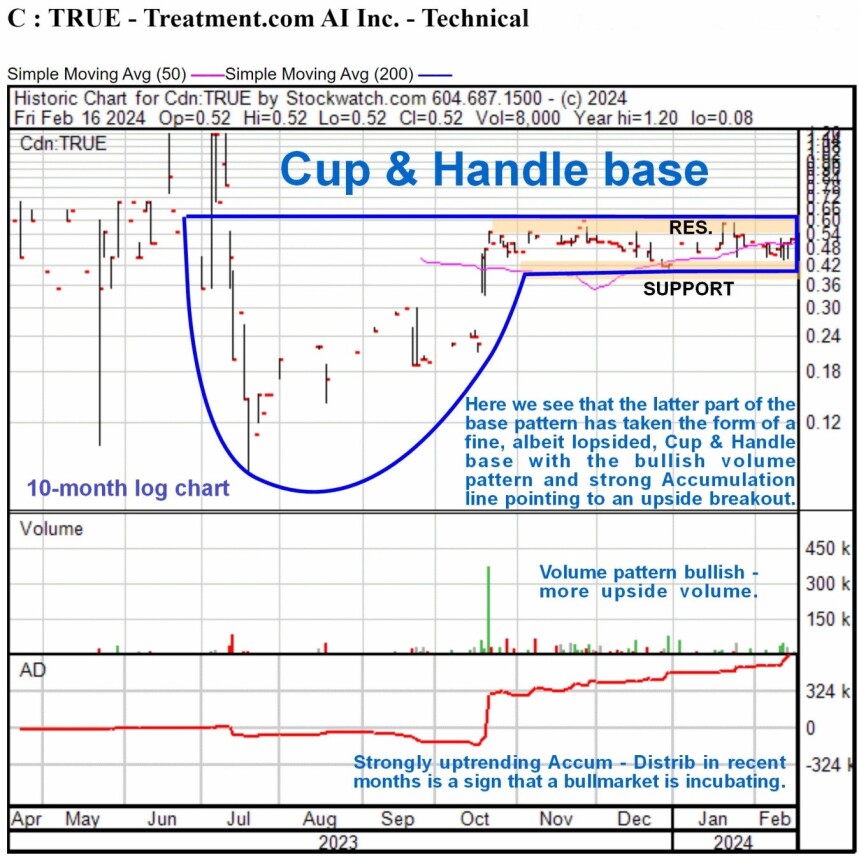
We will now move on to review recent action in much more detail on a 10-month chart where we see that, embedded within the latter part of the Head-and-Shoulders bottom, is a fine, albeit lopsided, Cup & Handle base whose most distinguishing characteristic is high volume on the rally to complete the right side of the Cup part of it, which is exactly what we saw back in October.
These kinds of hybrid patterns, where the price chart has the characteristics of different base patterns simultaneously, are not uncommon, and happily, both the patterns we see on the Treatment.com AI chart are decidedly bullish. The Handle part of this Cup & Handle base, which started to form in mid-October, has been a remarkably narrow trading range, and the good news is that we can be reasonably confident of an upside breakout before much longer, thanks to the Accumulation line trending higher throughout, due to a preponderance of upside volume.

The conclusion is, with a breakout from the base pattern looking increasingly likely soon, the stock is rated a Strong Buy for all timeframes, and the upside potential from the current historically low level is very substantial, especially in percentage terms. The number of shares in issue is a reasonable 38.5 million.
Treatment.com AI closed at CA$0.52 on February 15, 2024.
Important Disclosures:
- As of the date of this article, officers and/or employees of Streetwise Reports LLC (including members of their household) own securities of Treatment.com AI Inc..
- Author Certification and Compensation: [Clive Maund of clivemaund.com] is being compensated as an independent contractor by Street Smart, an affiliate of Streetwise Reports, for writing this article. Maund received his UK Technical Analysts’ Diploma in 1989. The recommendations and opinions expressed in this content accurately reflect the personal, independent, and objective views of the author regarding any and all of the designated securities discussed. No part of the compensation received by the author was, is, or will be directly or indirectly related to the specific recommendations or views expressed.
- Statements and opinions expressed are the opinions of the author and not of Streetwise Reports, Street Smart, or their officers. The author is wholly responsible for the accuracy of the statements. Streetwise Reports requires contributing authors to disclose any shareholdings in, or economic relationships with, companies that they write about. Any disclosures from the author can be found below. Streetwise Reports relies upon the authors to accurately provide this information and Streetwise Reports has no means of verifying its accuracy.
- This article does not constitute investment advice and is not a solicitation for any investment. Streetwise Reports does not render general or specific investment advice and the information on Streetwise Reports should not be considered a recommendation to buy or sell any security. Each reader is encouraged to consult with his or her personal financial adviser and perform their own comprehensive investment research. By opening this page, each reader accepts and agrees to Streetwise Reports’ terms of use and full legal disclaimer. Streetwise Reports does not endorse or recommend the business, products, services or securities of any company.
For additional disclosures, please click here.
Clivemaund.com Disclosures
The above represents the opinion and analysis of Mr. Maund, based on data available to him, at the time of writing. Mr. Maund’s opinions are his own, and are not a recommendation or an offer to buy or sell securities. As trading and investing in any financial markets may involve serious risk of loss, Mr. Maund recommends that you consult with a qualified investment advisor, one licensed by appropriate regulatory agencies in your legal jurisdiction and do your own due diligence and research when making any kind of a transaction with financial ramifications. Although a qualified and experienced stock market analyst, Clive Maund is not a Registered Securities Advisor. Therefore Mr. Maund’s opinions on the market and stocks can only be construed as a solicitation to buy and sell securities when they are subject to the prior approval and endorsement of a Registered Securities Advisor operating in accordance with the appropriate regulations in your area of jurisdiction.

- Tariffs on US imports come into effect today. The RBNZ expectedly lowered the rate by 0.25% Apr 9, 2025
- Volatility in financial markets is insane. Oil fell to $60.7 per barrel Apr 8, 2025
- Japanese Yen Recovers Some Losses as Investors Seek Safe-Haven Assets Apr 8, 2025
- The sell-off in risk assets intensified as tariffs took effect Apr 7, 2025
- COT Metals Charts: Speculator Bets led lower by Gold, Copper & Silver Apr 5, 2025
- COT Bonds Charts: Speculator Bets led by SOFR 1-Month & US Treasury Bonds Apr 5, 2025
- COT Soft Commodities Charts: Speculator Bets led by Soybean Oil, Cotton & Soybeans Apr 5, 2025
- COT Stock Market Charts: Speculator Bets led by S&P500 & Nasdaq Apr 5, 2025
- Today, investors focus on the Non-Farm Payrolls labor market report Apr 4, 2025
- USD/JPY collapses to a 6-month low: safe-haven assets in demand Apr 4, 2025
