Technical Analyst Clive Maund takes a look at Defense Metals Corp.’s 5-year, 15-month, 4-month, and 2-month charts to explain why he believes it is an Immediate Speculative Buy.
Given the excellent and improving fundamentals for Defense Metals Corp. (DEFN:TSX.V; DFMTF:OTCQB; 35D:FSE), it is rather surprising that its stock is not already a lot higher than it is. The core of the story is that the company is advancing a major Rare Earth Metals resource that is situated in North America toward production at a time when demand looks set to ramp up due to increasing demand from the defense industry due to the proliferation of various military conflicts around the world as supplies from the world’s biggest producer of Rare Earth Metals — China — are at risk of being choked off and possibly halted completely.
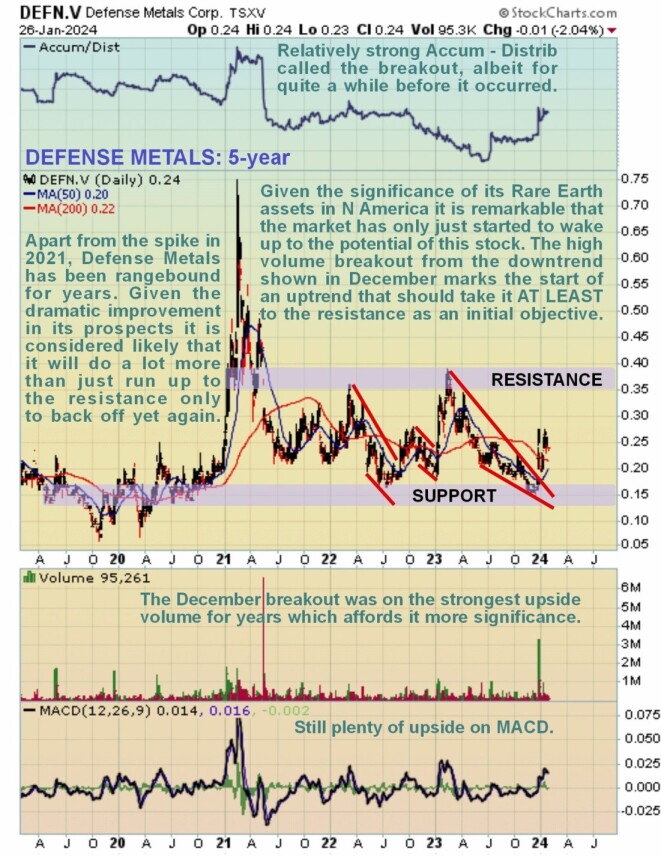
On its 5-year chart, we see that, apart from a dramatic spike early in 2021 that was completely reversed, the price has essentially been rangebound throughout this period, but even on this long-term chart, we can see that there is something different about the recent rally which kicked off with a large gap move out of the preceding downtrend that was accompanied by the strongest upside volume for at least 5 years, driving the Accumulation line strongly higher.
This action implies that it is going to do more — probably a lot more — than simply rally up to the resistance level shown at the upper boundary of the broad trading range.

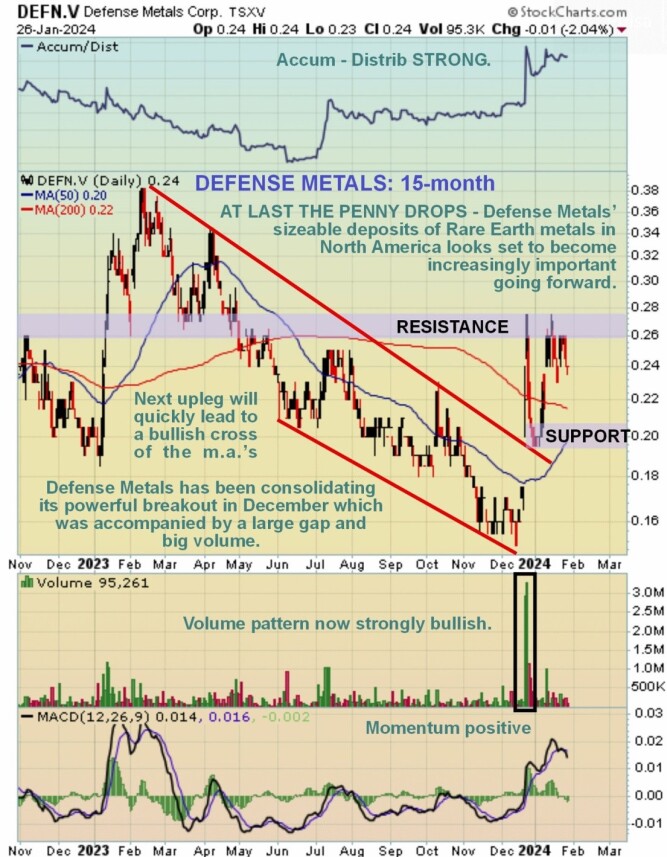
Zooming in via a 15-month chart that allows us to see the preceding downtrend in its entirety, we can see the powerful breakout last month. This move was on a very heavy volume and accompanied by a large gap, which, taken together, have strongly bullish long-term implications and portend that the stock will eventually head much higher.
This advance took the price up quickly to hit the resistance level in an overbought state, which is why it has since stopped to consolidate.

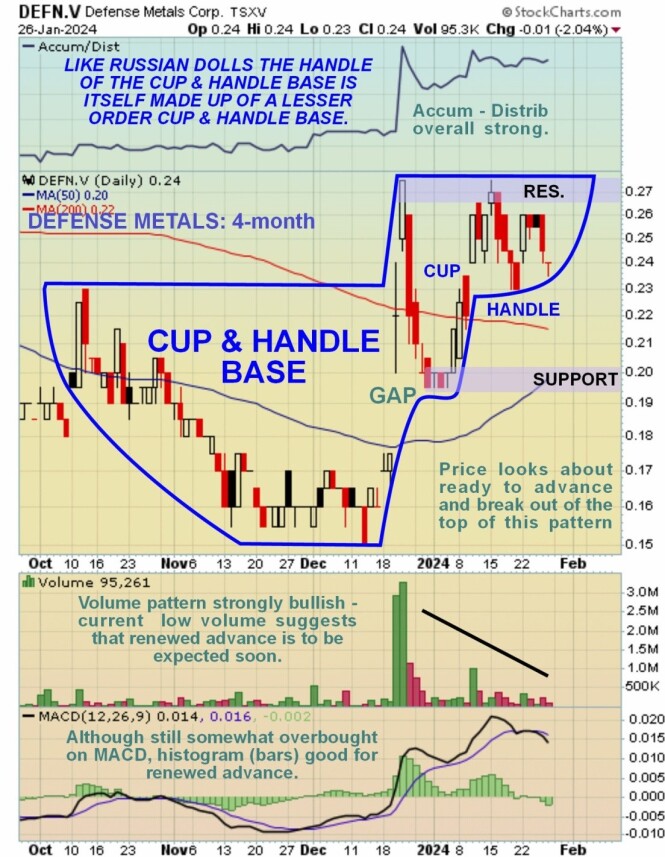
On the 4-month chart, we can examine recent action in much more detail, and on this chart it can be discerned that all of the action leading into the recent low and that has followed comprises a rather odd-shaped Cup & Handle base and it is clear that, following the move that broke the price out of the downtrend in December, it has been consolidating to form the Handle of this base pattern, with this period of consolidation allowing time for the earlier overbought condition to ease and for the rising 50-day moving average to pull up closer to the price, the better to propel the next upleg that will break the price out above the resistance at the top of the Handle of the pattern and quickly lead to a bullish cross of the moving averages. Interestingly and unusually, the Handle of this pattern itself contains a lower order Cup & Handle continuation pattern rather in the manner of “Russian dolls” that we will now look at on a 2-month chart.

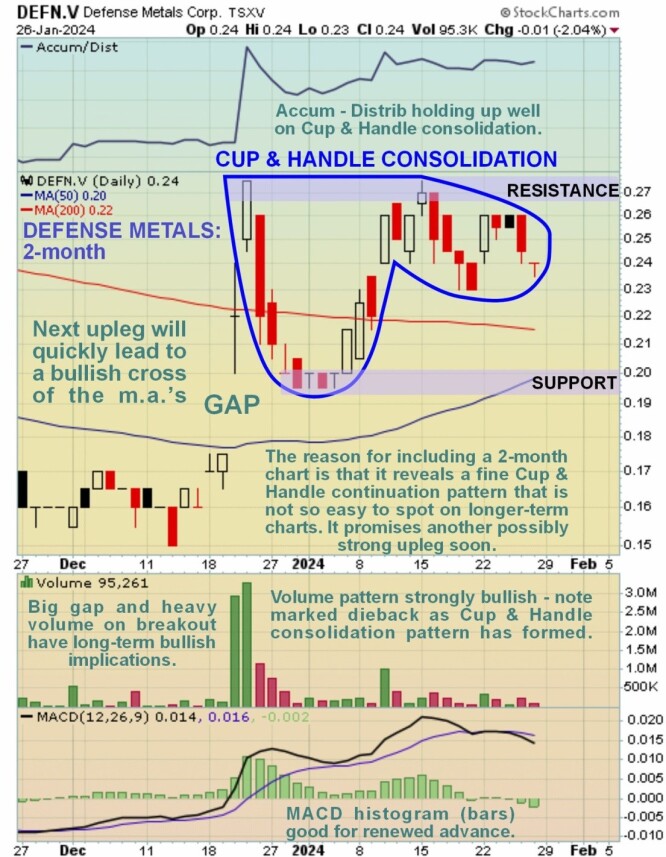
The 2-month chart “opens out” the action following the sharp December breakout move, enabling us to see the fine small Cup & Handle pattern that has formed, which, unlike the larger order Cup & Handle pattern, is not classed as a base, because it has nothing to reverse, and it is therefore instead classed as Cup & Handle continuation pattern, rather like the Head-and-Shoulders continuation patterns that we sometimes see.
The most important point to observe on this chart, apart from the price action, is the strongly bullish volume pattern, with the gap breakout move being on heavy volume that has since progressively died back, especially as the Handle of this little pattern has formed, with the Accumulation line holding up well all the while.
With the Handle of this pattern looking complete and the Handle of the larger order pattern shown on the 4-month chart also looking complete, and volume now very light, the right conditions exist for another upleg to start soon.

Defense Metals is therefore rated an Immediate Strong Buy for all timeframes, and it is not regarded as being an unduly speculative investment.
Defense Metals’ website.
Defense Metals Corp. closed at CA$0.24, $0.18 on January 26, 2024.
Important Disclosures:
- [Defense Metals Corp.] is a billboard sponsor of Streetwise Reports and pays SWR a monthly sponsorship fee between US$4,000 and US$5,000.
- As of the date of this article, officers and/or employees of Streetwise Reports LLC (including members of their household) own securities of [Defense Metals Corp.].
- Street Smart, an affiliate of Streetwise Reports, has compensated [Clive Maund], for writing this article. However, the views, opinions, analyses, and any recommendations in [Maund]‘s article are solely their own personal views, opinions, analyses, and recommendations, and are expressly not those of Street Smart or Streetwise Reports. The content created by [Maund] is about companies they believe in based on their personal investment opinions and analyses, and their opinions and analyses are not influenced or dictated by Streetwise Reports or its affiliates or as a result of compensation provided by Street Smart.
- Statements and opinions expressed are the opinions of the author and not of Streetwise Reports, Street Smart, or their officers. The author is wholly responsible for the accuracy of the statements. Streetwise Reports was not paid by the author to publish or syndicate this article. Streetwise Reports requires contributing authors to disclose any shareholdings in, or economic relationships with, companies that they write about. Any disclosures from the author can be found below. Streetwise Reports relies upon the authors to accurately provide this information and Streetwise Reports has no means of verifying its accuracy.
- This article does not constitute investment advice and is not a solicitation for any investment. Streetwise Reports does not render general or specific investment advice and the information on Streetwise Reports should not be considered a recommendation to buy or sell any security. Each reader is encouraged to consult with his or her personal financial adviser and perform their own comprehensive investment research. By opening this page, each reader accepts and agrees to Streetwise Reports’ terms of use and full legal disclaimer. Streetwise Reports does not endorse or recommend the business, products, services or securities of any company.
For additional disclosures, please click here.
Clivemaund.com Disclosures
The above represents the opinion and analysis of Mr. Maund, based on data available to him, at the time of writing. Mr. Maund’s opinions are his own, and are not a recommendation or an offer to buy or sell securities. As trading and investing in any financial markets may involve serious risk of loss, Mr. Maund recommends that you consult with a qualified investment advisor, one licensed by appropriate regulatory agencies in your legal jurisdiction and do your own due diligence and research when making any kind of a transaction with financial ramifications. Although a qualified and experienced stock market analyst, Clive Maund is not a Registered Securities Advisor. Therefore Mr. Maund’s opinions on the market and stocks can only be construed as a solicitation to buy and sell securities when they are subject to the prior approval and endorsement of a Registered Securities Advisor operating in accordance with the appropriate regulations in your area of jurisdiction.
