
By RoboForex Analytical Department
Brent prices have been rising for three consecutive days as of this Monday. The price of a Brent barrel has climbed to 79.00 USD, and there are underlying reasons for this surge.
The focal point of attention is the unfolding events in the Red Sea, where the situation is challenging. This holds significant importance for the crude oil market as numerous tankers with energy carriers pass through these waters. Any disruptions in transportation accessibility could potentially impact the crude oil supply. The market incorporates this concern into its quotes. While some tankers have already altered their routes, others continue passing through the Red Sea.
The Libyan factor also supports oil bulls. Protests in the country might lead to a shutdown of two additional oil and gas organisations. Earlier, operations were halted at the Sharara field, causing the market to lose approximately 300 thousand barrels of crude oil daily.
Meanwhile, various drivers exert pressure on the market. Increasing crude oil production among non-OPEC+ members, including the US, is one such factor. Additionally, there is uncertainty in Chinese crude oil demand.
Brent technical analysis
Free Reports:
 Get our Weekly Commitment of Traders Reports - See where the biggest traders (Hedge Funds and Commercial Hedgers) are positioned in the futures markets on a weekly basis.
 Sign Up for Our Stock Market Newsletter – Get updated on News, Charts & Rankings of Public Companies when you join our Stocks Newsletter
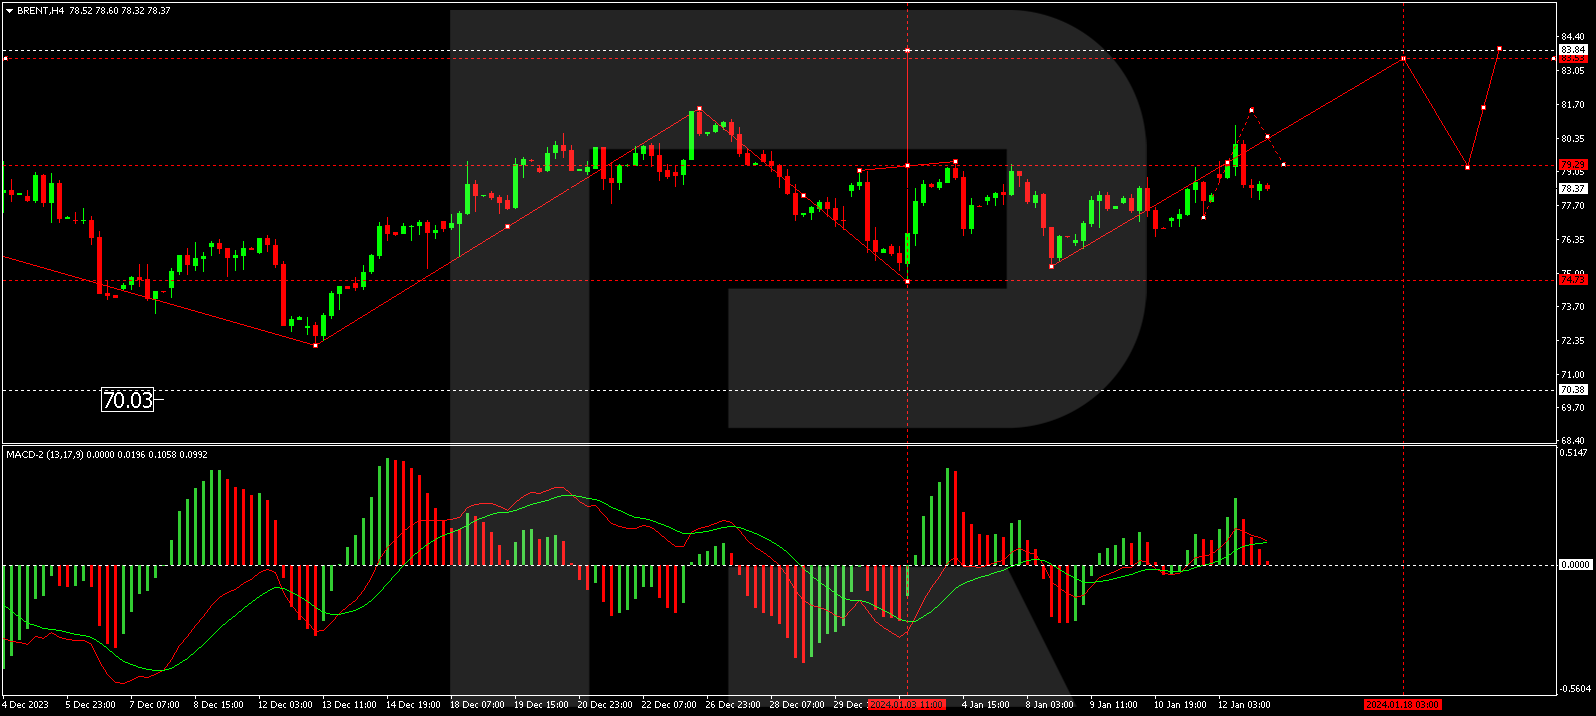
On the H4 Brent chart, a growth wave structure is emerging towards 82.15. Once this level is reached, a correction link to 79.30 is expected, followed by a rise to 83.43. This is a local target. Technically, this scenario is confirmed by the MACD: its signal line is above zero, strictly pointing upwards.
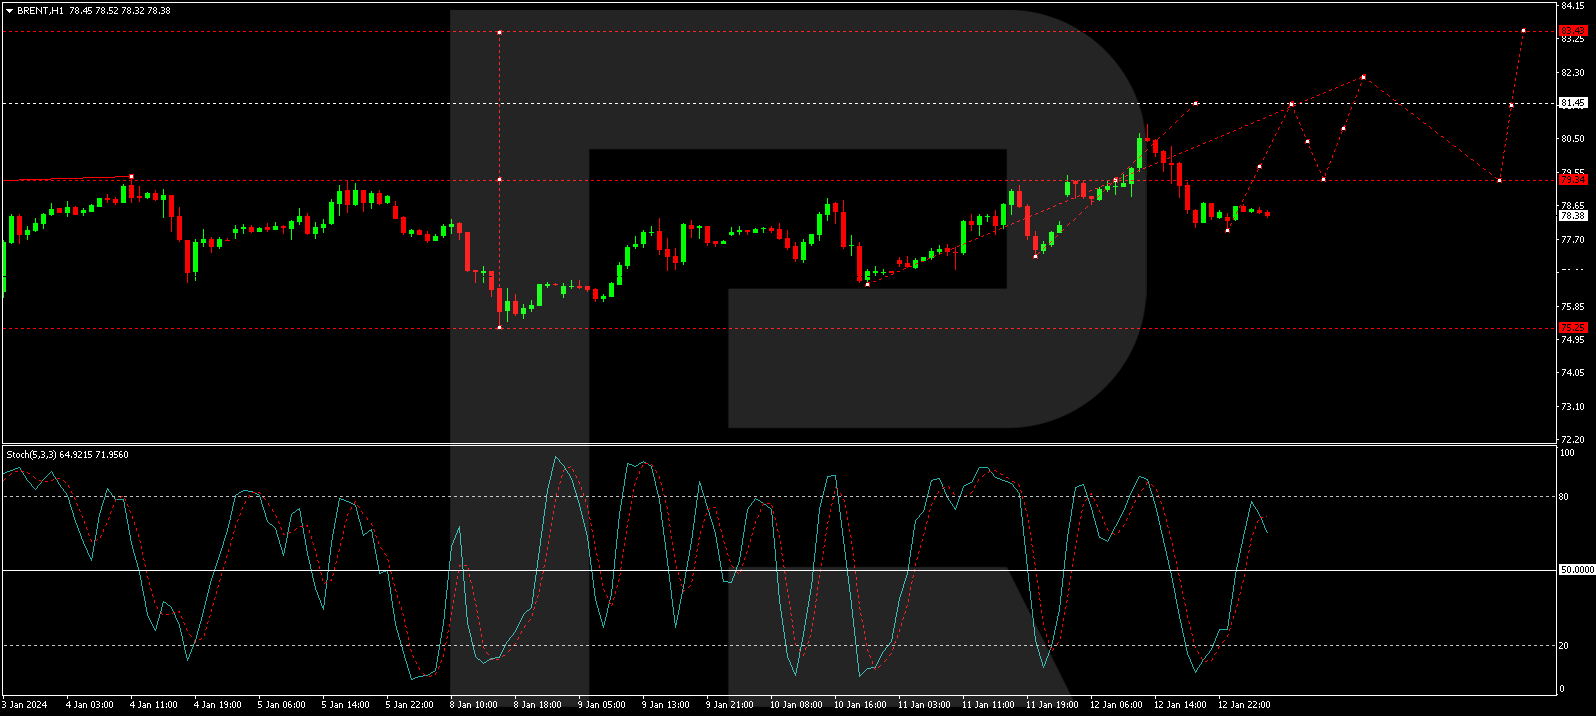
On the H1 Brent chart, a consolidation range is developing around 79.35. A growth structure to 81.45 is expected, followed by a correction to 79.40 and a rise to 82.15. This is a local target. Technically, this scenario is confirmed by the Stochastic oscillator, with its signal line above 50, aiming strictly upwards to 80.
Disclaimer
Any forecasts contained herein are based on the author’s particular opinion. This analysis may not be treated as trading advice. RoboForex bears no responsibility for trading results based on trading recommendations and reviews contained herein.

- The Bank of Canada kept its interest rate unchanged. Platinum prices reached a three‑week high Jul 16, 2026
- Stock indices rose after the release of US inflation data. China’s GDP slowed sharply Jul 15, 2026
- GBP/USD Awaits Political News: What Will Happen Next Jul 15, 2026
- USD/JPY Holds at Highs: Pressure Lingers on Yen Jul 14, 2026
- Oil prices jumped 4% amid a new wave of escalation between the US and Iran Jul 13, 2026
- EUR/USD: US Inflation Will Determine Everything Jul 13, 2026
- COT Metals Charts: Weekly Speculator Bets see small gains for Silver & Gold Jul 12, 2026
- COT Bonds Charts: Speculator Bets led by SOFR 3-Months & 2-Year Bonds Jul 12, 2026
- COT Energy Charts: Weekly Speculator Changes led by Brent Oil Jul 12, 2026
- COT Soft Commodities Charts: Weekly Speculator Changes led by Sugar, Corn & Soybeans Jul 12, 2026