
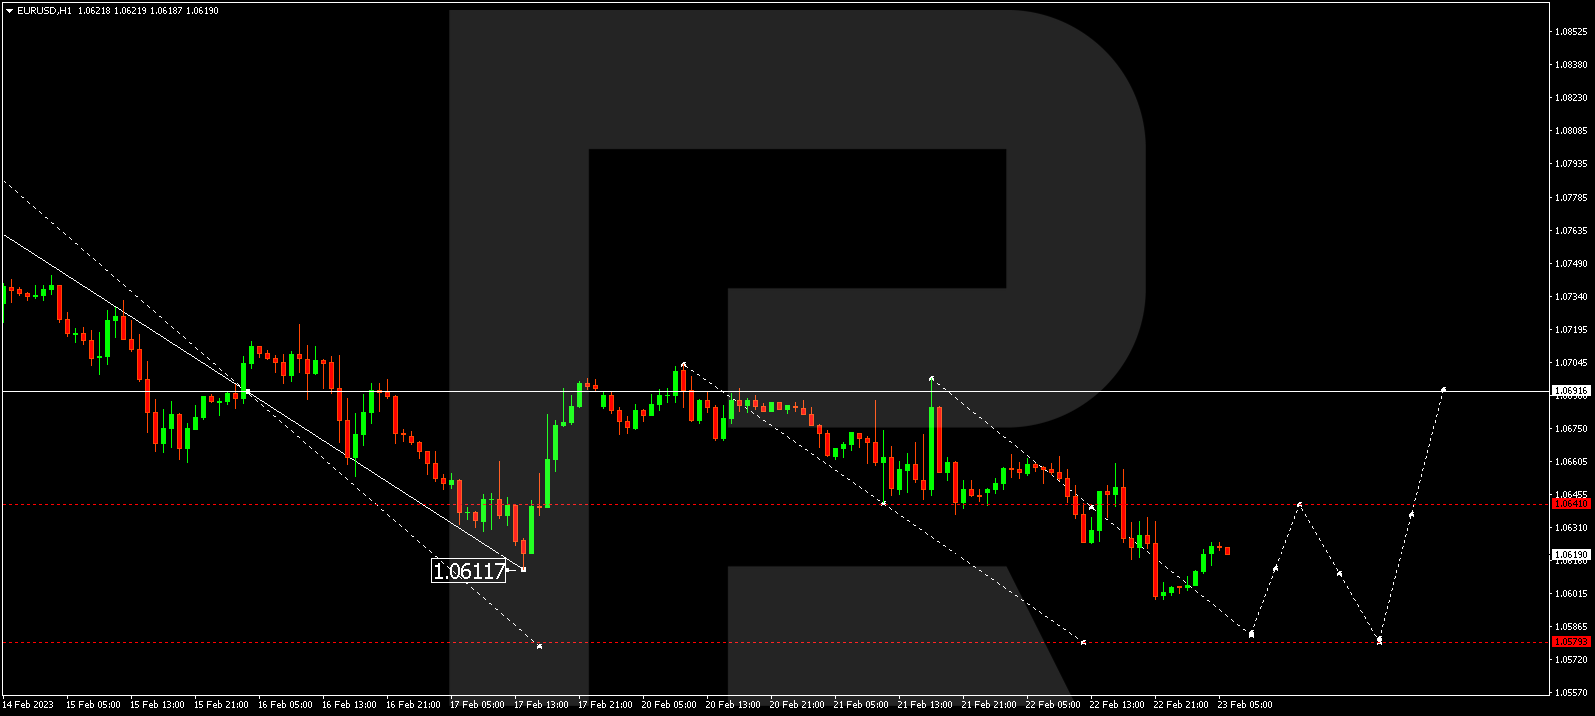
EURUSD, “Euro vs US Dollar”
The currency pair has completed a wave of decline to 1.0600. Today the market might demonstrate a link of correction to 1.0640. Then a decline to 1.0584 should follow. And with a breakaway of this level as well, a pathway for the wave down to 1.0579 should open.

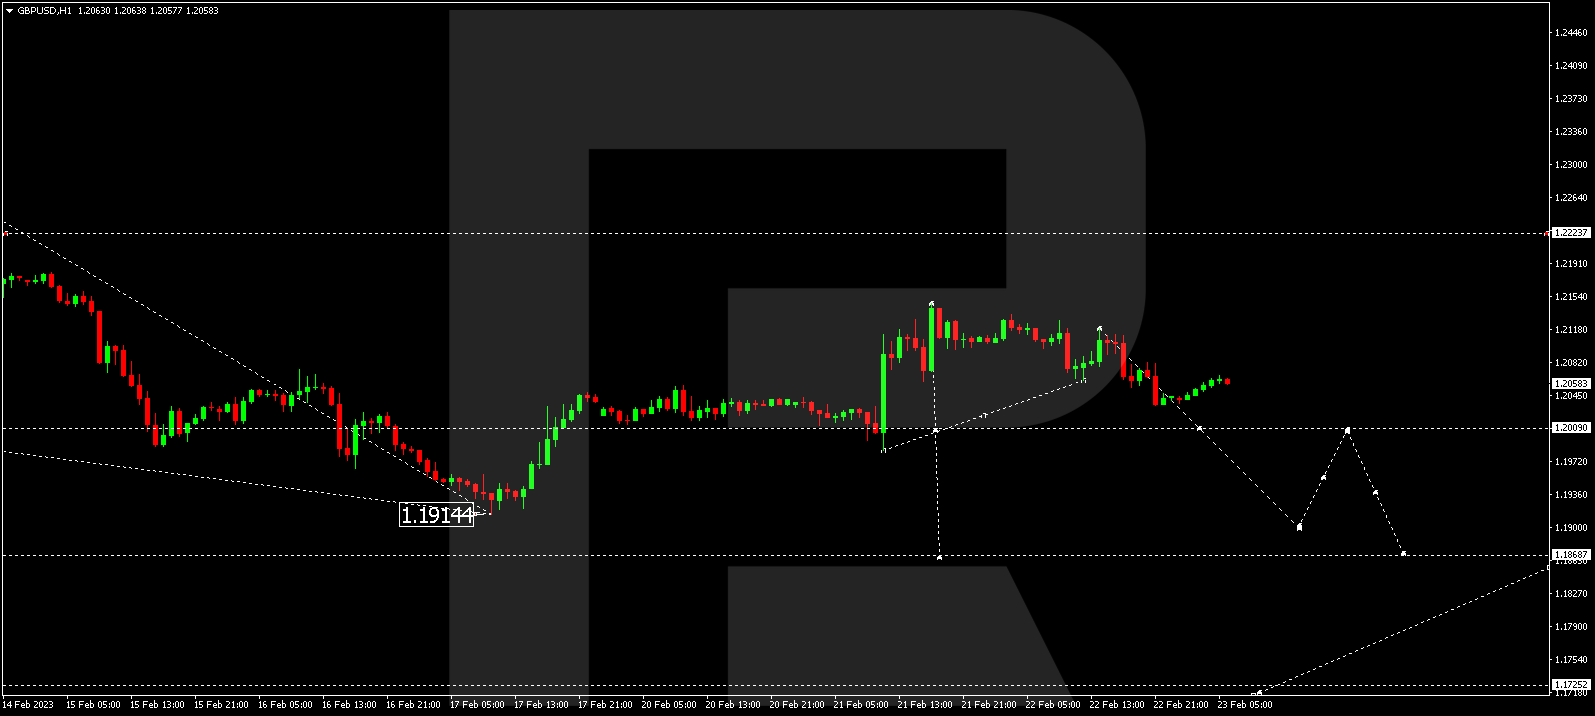
GBPUSD, “Great Britain Pound vs US Dollar”
The currency pair continues developing a structure of decline to 1.2000. After this level is reached, a consolidation range should form around it. With an escape downwards, a pathway to 1.1900 should open. And with a breakaway of this one, a pathway for the wave down to 1.1866 should open.
Free Reports:
 Sign Up for Our Stock Market Newsletter – Get updated on News, Charts & Rankings of Public Companies when you join our Stocks Newsletter
 Get our Weekly Commitment of Traders Reports - See where the biggest traders (Hedge Funds and Commercial Hedgers) are positioned in the futures markets on a weekly basis.
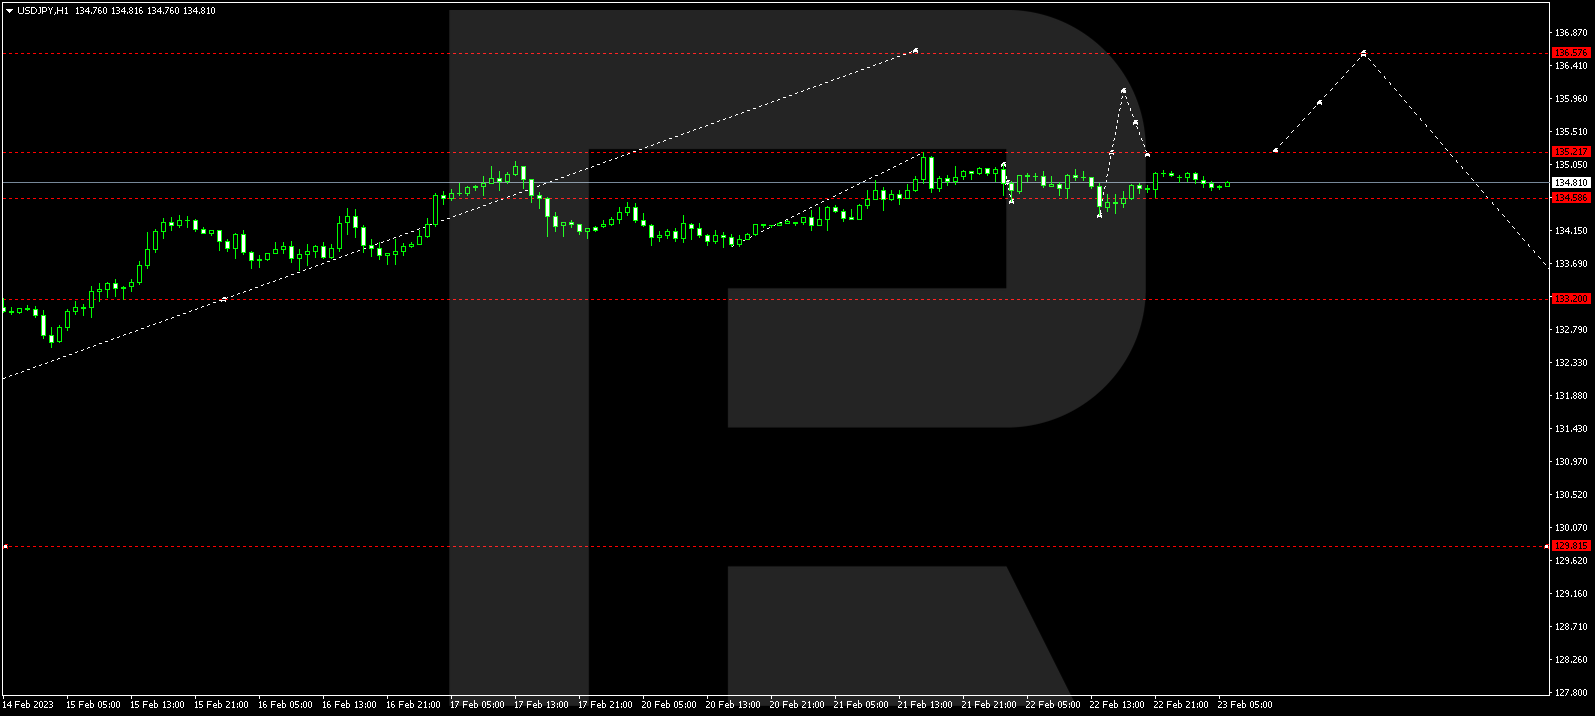
USDJPY, “US Dollar vs Japanese Yen”
The currency pair has completed a wave of correction to 134.36. Today a link of growth to 135.25 is expected. And with a breakaway of this level upwards as well, a pathway for a wave to 136.00 should open. Then a link of decline to 135.24 and growth to 136.55 are not excluded.
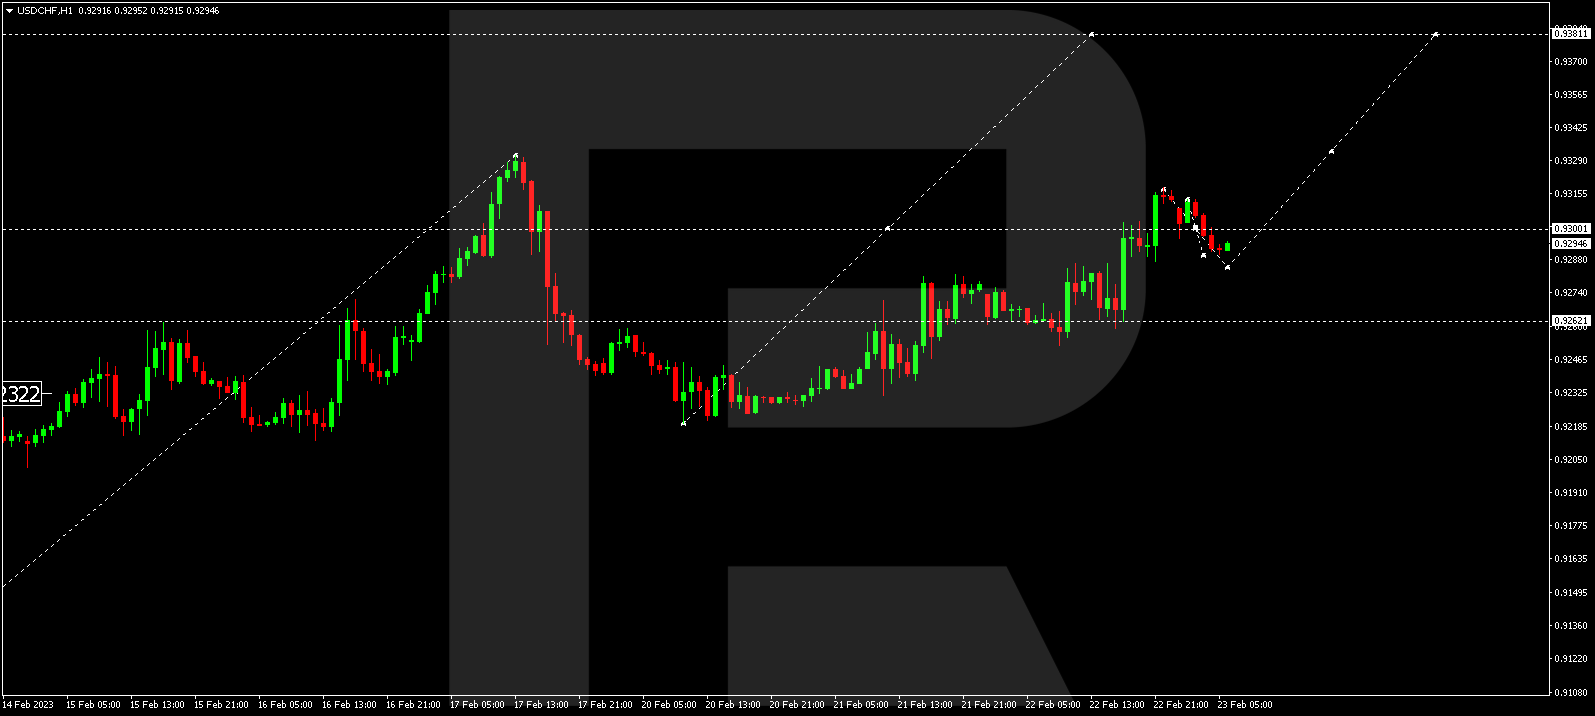
USDCHF, “US Dollar vs Swiss Franc”
The currency pair continues developing a consolidation range around 0.9300. Today a link of decline to 0.9282 looks possible. Then the quotes might grow to 0.9330, from where the wave should continue to 0.9380.
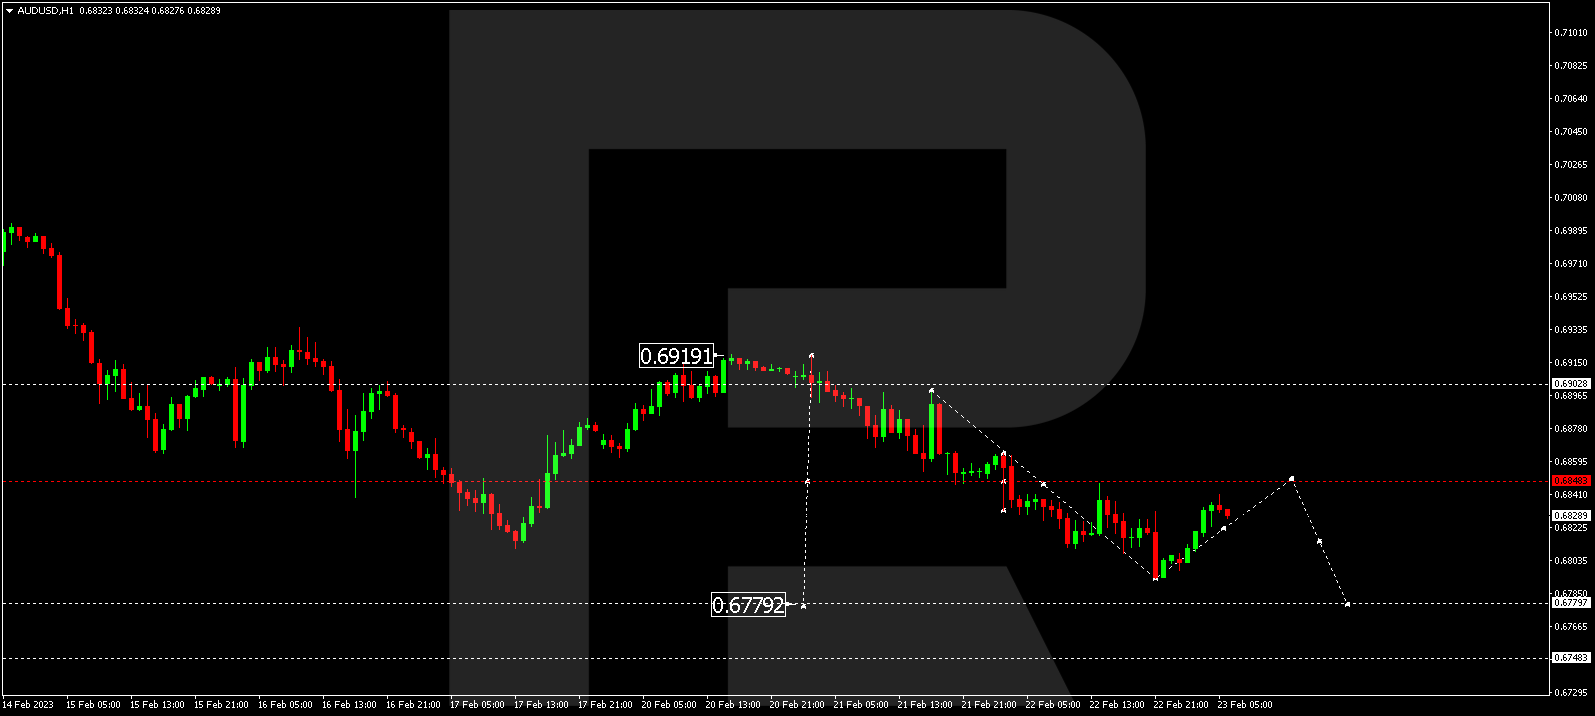
AUDUSD, “Australian Dollar vs US Dollar”
The currency pair has completed a structure of a wave of decline to 0.6793. Today the market is forming a link of correction to 0.6848. After the correction is over, a link of decline to 0.6780 should begin.
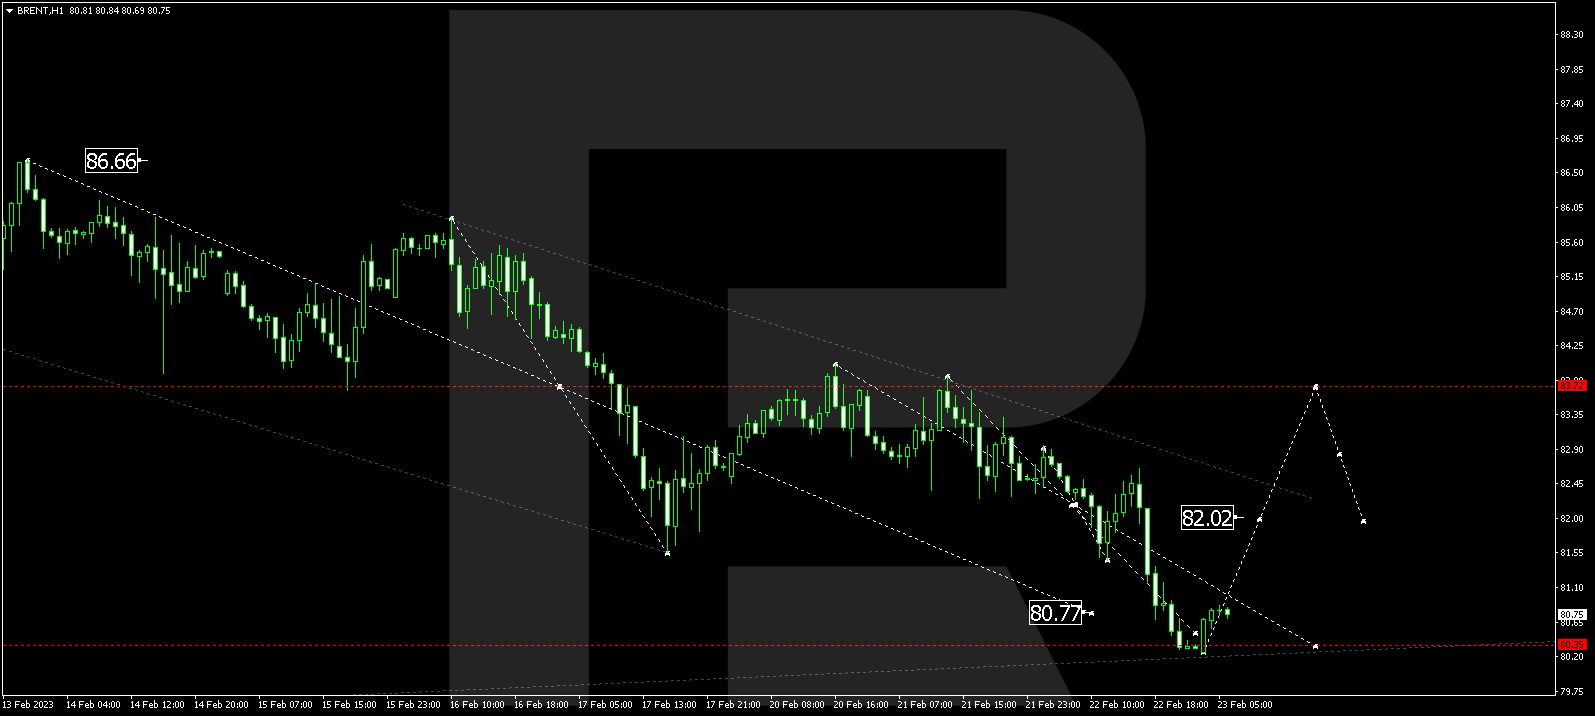
BRENT
Brent has completed a wave of decline to 80.30. Today a consolidation range should develop above this level. With an escape upwards, a wave of growth to 83.33 should start. The goal is first.
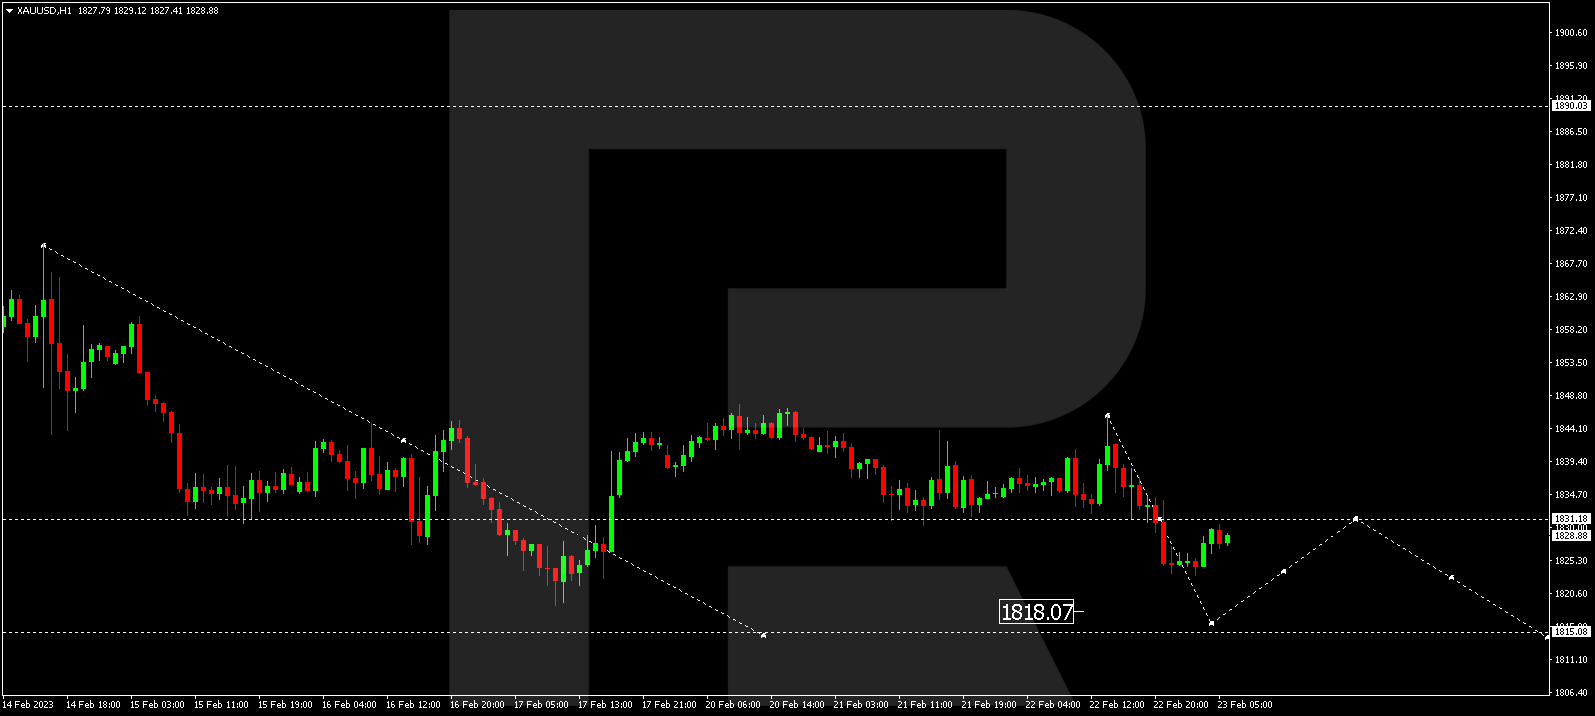
XAUUSD, “Gold vs US Dollar”
Gold has broken through 1831.15 down, extending the consolidation range to 1823.15. A test of 1831.18 from below is not excluded today. Then a decline to 1818.00 should follow, so that the wave should continue to 1815.00.
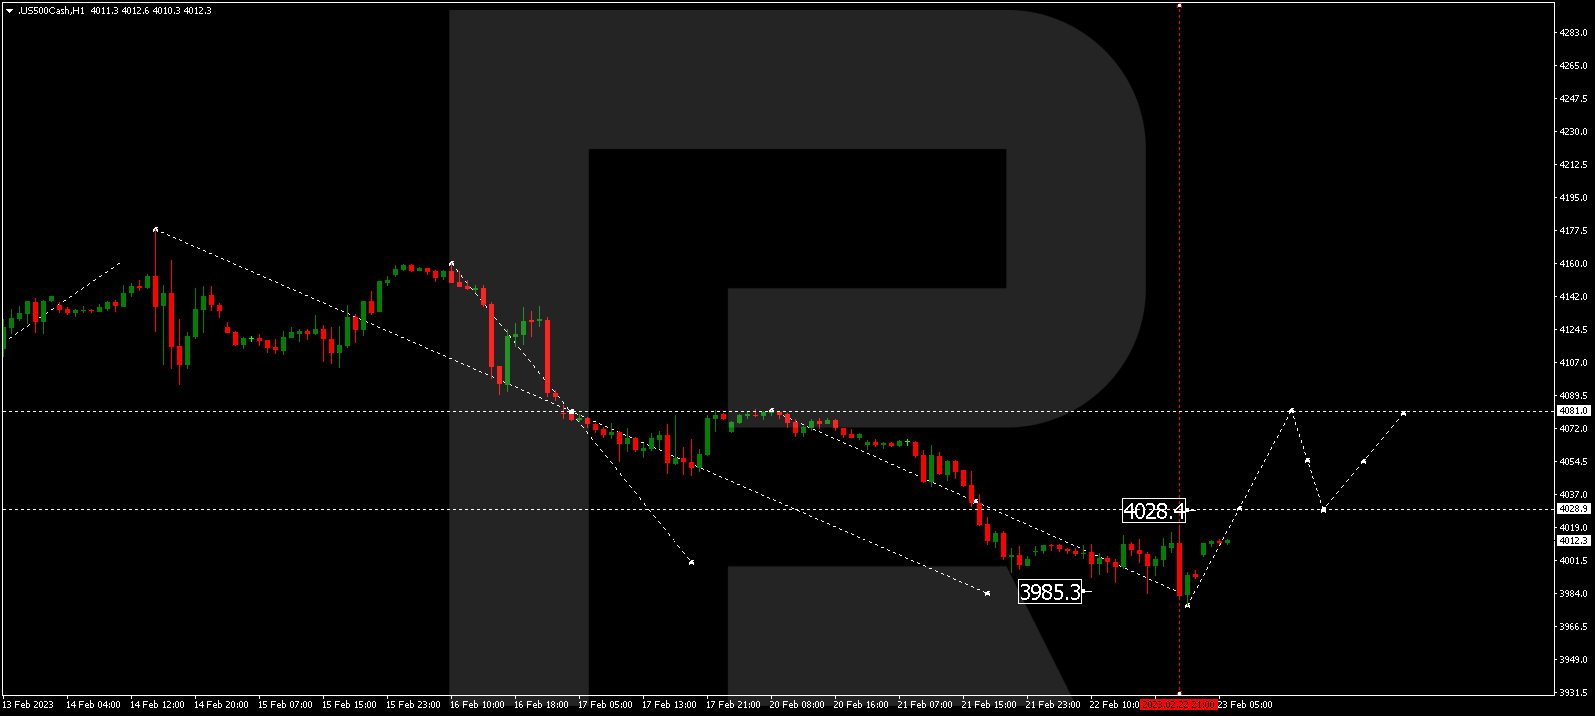
S&P 500
The stock index has completed a wave of decline to 3977.7. Today a consolidation range is forming above this level. With an escape upwards, a pathway for a wave to 4028.0 should open. Then a consolidation range might develop, and with an escape upwards the pair might grow to 4081.0.
Article By RoboForex.com
Attention!
Forecasts presented in this section only reflect the author’s private opinion and should not be considered as guidance for trading. RoboForex LP bears no responsibility for trading results based on trading recommendations described in these analytical reviews.

- COT Metals Charts: Speculator Bets led by Silver, Gold & Platinum Mar 7, 2026
- COT Bonds Charts: Speculator Bets led by 10-Year Bonds & Fed Funds Mar 7, 2026
- COT Energy Charts: Speculator Bets led by Brent Oil & Heating Oil Mar 7, 2026
- COT Soft Commodities Charts: Speculator Bets led by Corn & Soybean Meal Mar 7, 2026
- Investors run to safe-haven assets amid Middle East escalation Mar 6, 2026
- EUR/USD Under Pressure: Middle East Risks Outweigh All Else Mar 6, 2026
- Bitcoin shows resilience to Middle East events. Oil market stabilizes Mar 5, 2026
- GBP/USD: Market Not Expecting BoE Rate Cut in March Mar 5, 2026
- Brent headed for $100? Mar 4, 2026
- Global stock indices continue sell-off due to Middle East conflict Mar 4, 2026