
AUDUSD, “Australian Dollar vs US Dollar”
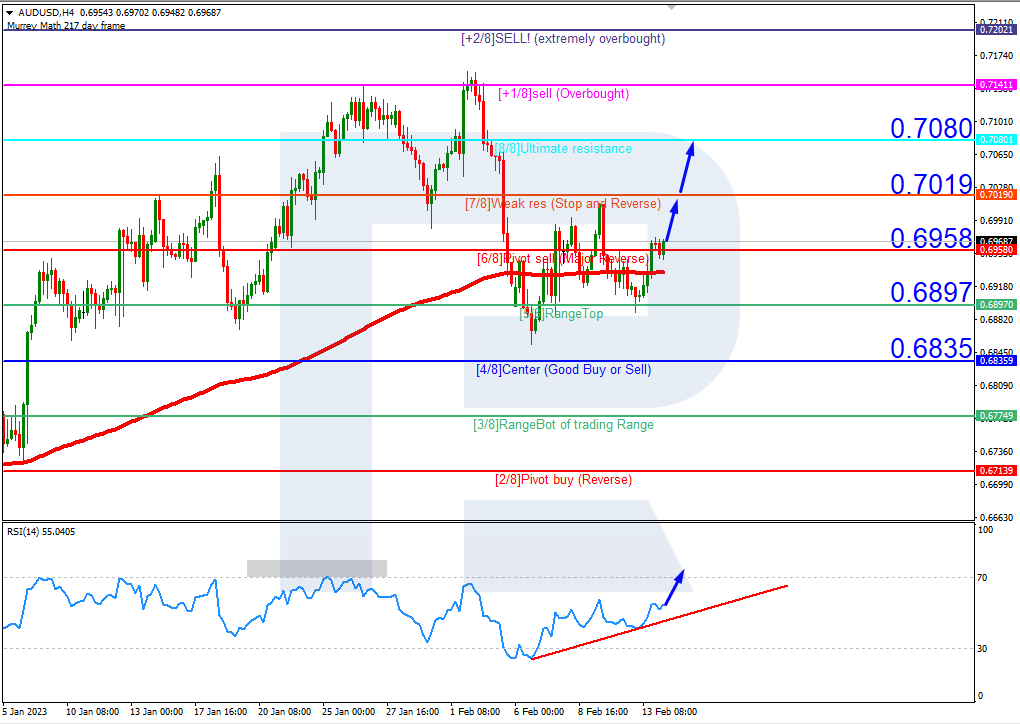
On H4, the quotes have broken through the 200-day Moving Average and are now above it, which reveals possible development of an uptrend. The RSI has bounced off the support line. An upward breakaway of 7/8 (0.7019) should be expected, followed by growth of the resistance level of 8/8 (0.7080). The scenario can be cancelled by a downward breakaway of the support level of 5/8 (0.6897). In this case, the pair may drop to 3/8 (0.6774).

On M15, the upper line of VoltyChannel is broken away, which increases the probability of further growth on H4.

Free Reports:
 Get our Weekly Commitment of Traders Reports - See where the biggest traders (Hedge Funds and Commercial Hedgers) are positioned in the futures markets on a weekly basis.
 Download Our Metatrader 4 Indicators – Put Our Free MetaTrader 4 Custom Indicators on your charts when you join our Weekly Newsletter
NZDUSD, “New Zealand Dollar vs US Dollar”
On H4, the quotes are under the 200-day Moving Average, which reveals the prevalence of a downtrend. The RSI is testing the resistance line. A test of 3/8 (0.6286) is expected, followed by falling to the support level of 2/8 (0.6225). The scenario can be cancelled by rising over the resistance level of 5/8 (0.6408), which might lead to a trend reversal and growth to 6/8 (0.6469).

On M15, an additional signal confirming the decline will be a breakaway of the lower border of VoltyChannel.

Article By RoboForex.com
Attention!
Forecasts presented in this section only reflect the author’s private opinion and should not be considered as guidance for trading. RoboForex LP bears no responsibility for trading results based on trading recommendations described in these analytical reviews.

- Trump signals de-escalation in the Middle East; China’s trade surplus hits a new record Mar 10, 2026
- EUR/USD in Turbulence: Market Questions When Conflict Over Iran Will End Mar 10, 2026
- Prices push oil above $100 per barrel Mar 9, 2026
- COT Metals Charts: Speculator Bets led by Silver, Gold & Platinum Mar 7, 2026
- COT Bonds Charts: Speculator Bets led by 10-Year Bonds & Fed Funds Mar 7, 2026
- COT Energy Charts: Speculator Bets led by Brent Oil & Heating Oil Mar 7, 2026
- COT Soft Commodities Charts: Speculator Bets led by Corn & Soybean Meal Mar 7, 2026
- Investors run to safe-haven assets amid Middle East escalation Mar 6, 2026
- EUR/USD Under Pressure: Middle East Risks Outweigh All Else Mar 6, 2026
- Bitcoin shows resilience to Middle East events. Oil market stabilizes Mar 5, 2026