By InvestMacro.com | #stocks #NIO #RSI-Oversold
NIO Inc. End of Day Update: October 13 2022
The NIO Inc. (NIO) stock finished the day with a gain of 3.48 percent and closed the day around the 12.78 price level, according to unofficial data at the New York close.
NIO opened the trading day at the 12.35 price level with the high of the day being 12.85 and the low of the day at 11.95.
The stock bounced off of the $12.00 support level today after touching the lowest trading level since May. NIO had dropped for six straight days and for fourteen out of the previous eighteen days before today’s rebound.
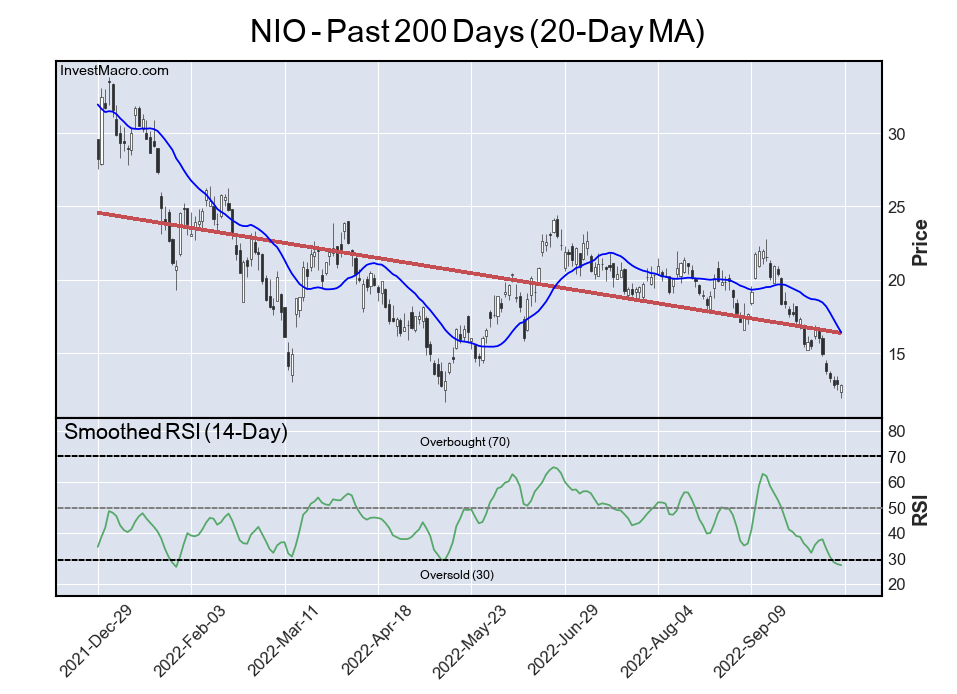
The NIO Trend is Lower, RSI level is Bearish-Oversold
The stock is currently trending lower over the past 200 trading days, according to the linear regression best-fit line (red) seen on the chart below. NIO shares had been trading as high as $40 dollars in December of 2021 before trending lower over the course of this year.
The Relative Strength Index, an indicator that can identify overbought (above 70) and oversold levels (below 30), shows that the current RSI is at a 27.2 score. This is a Bearish-Oversold reading on the daily time-frame.
Free Reports:
 Sign Up for Our Stock Market Newsletter – Get updated on News, Charts & Rankings of Public Companies when you join our Stocks Newsletter
 Get our Weekly Commitment of Traders Reports - See where the biggest traders (Hedge Funds and Commercial Hedgers) are positioned in the futures markets on a weekly basis.
NIO Price Returns (Closing Price Changes)
The NIO has slid by -17.97 percent over the past 10 days while seeing a decline of -35.81 over the past 30 days. The 90-day change is -33.37 while the 180-day return and the 365-day return are -43.60 and -66.31, respectively.
By InvestMacro.com – – Get our stock market newsletter for stock rankings, charts & updates

- COT Metals Charts: Speculator Bets led by Silver, Gold & Platinum Mar 7, 2026
- COT Bonds Charts: Speculator Bets led by 10-Year Bonds & Fed Funds Mar 7, 2026
- COT Energy Charts: Speculator Bets led by Brent Oil & Heating Oil Mar 7, 2026
- COT Soft Commodities Charts: Speculator Bets led by Corn & Soybean Meal Mar 7, 2026
- Investors run to safe-haven assets amid Middle East escalation Mar 6, 2026
- EUR/USD Under Pressure: Middle East Risks Outweigh All Else Mar 6, 2026
- Bitcoin shows resilience to Middle East events. Oil market stabilizes Mar 5, 2026
- GBP/USD: Market Not Expecting BoE Rate Cut in March Mar 5, 2026
- Brent headed for $100? Mar 4, 2026
- Global stock indices continue sell-off due to Middle East conflict Mar 4, 2026