By InvestMacro.com | #stocks #NFLX
Netflix, Inc. End of Day Update: October 12 2022
The Netflix, Inc. (NFLX) stock finished the day with a gain of 3.07 percent and closed the day around the 220.87 price level, according to unofficial data at the New York close.
Netflix, a technology streaming company that trades on the Nasdaq, opened the trading day at 214.3 price level with the high of the day hitting 223.67 and the low of the day bottoming at 212.7.
The Netflix stock has been trading in a recent range between $215 and $250 over the past few months. The company has an earnings release next week (with estimates of 2.15 earnings per share currently) that could spark a new path for the stock.
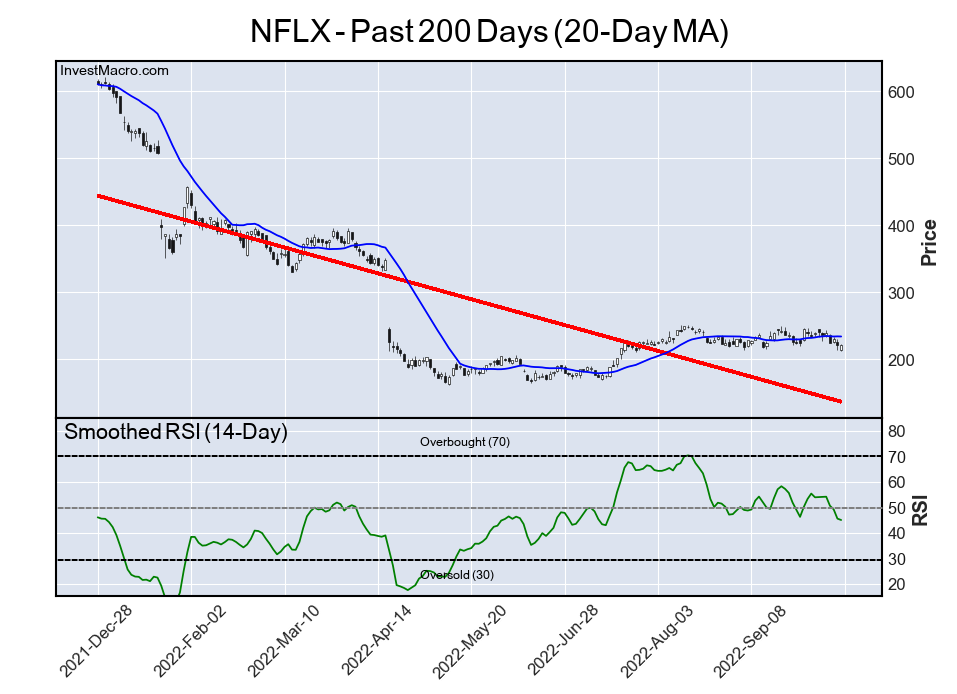
The NFLX Trend is Down, RSI level is Bearish
The stock is currently trending lower over the past 200 trading days, according to the linear regression line (red) seen on the chart below. Netflix has seen its share price fall from over $600 per share in December 2021 to just a little over a third of that amount as it trades at $220 today.
The Relative Strength Index, an indicator that can identify overbought (above 70) and oversold levels (below 30), shows that the current RSI is at a 43.0 score. This is a Bearish reading on the daily time-frame and the RSI line is headed lower as well.
Free Reports:
 Get our Weekly Commitment of Traders Reports - See where the biggest traders (Hedge Funds and Commercial Hedgers) are positioned in the futures markets on a weekly basis.
 Download Our Metatrader 4 Indicators – Put Our Free MetaTrader 4 Custom Indicators on your charts when you join our Weekly Newsletter
NFLX Price Returns (Closing Price Changes)
The NFLX has declined by -9.92 percent over the past 10 days while seeing a gain by 0.10 over the past 30 days. The 90-day change is 11.00 while the 180-day return and the 365-day return are -39.72 and -56.62, respectively.
By InvestMacro.com – – Get our stock market newsletter for stock rankings, news & updates

- COT Metals Charts: Speculator Bets led by Silver, Gold & Platinum Mar 7, 2026
- COT Bonds Charts: Speculator Bets led by 10-Year Bonds & Fed Funds Mar 7, 2026
- COT Energy Charts: Speculator Bets led by Brent Oil & Heating Oil Mar 7, 2026
- COT Soft Commodities Charts: Speculator Bets led by Corn & Soybean Meal Mar 7, 2026
- Investors run to safe-haven assets amid Middle East escalation Mar 6, 2026
- EUR/USD Under Pressure: Middle East Risks Outweigh All Else Mar 6, 2026
- Bitcoin shows resilience to Middle East events. Oil market stabilizes Mar 5, 2026
- GBP/USD: Market Not Expecting BoE Rate Cut in March Mar 5, 2026
- Brent headed for $100? Mar 4, 2026
- Global stock indices continue sell-off due to Middle East conflict Mar 4, 2026