
Article By RoboForex.com
BRENT
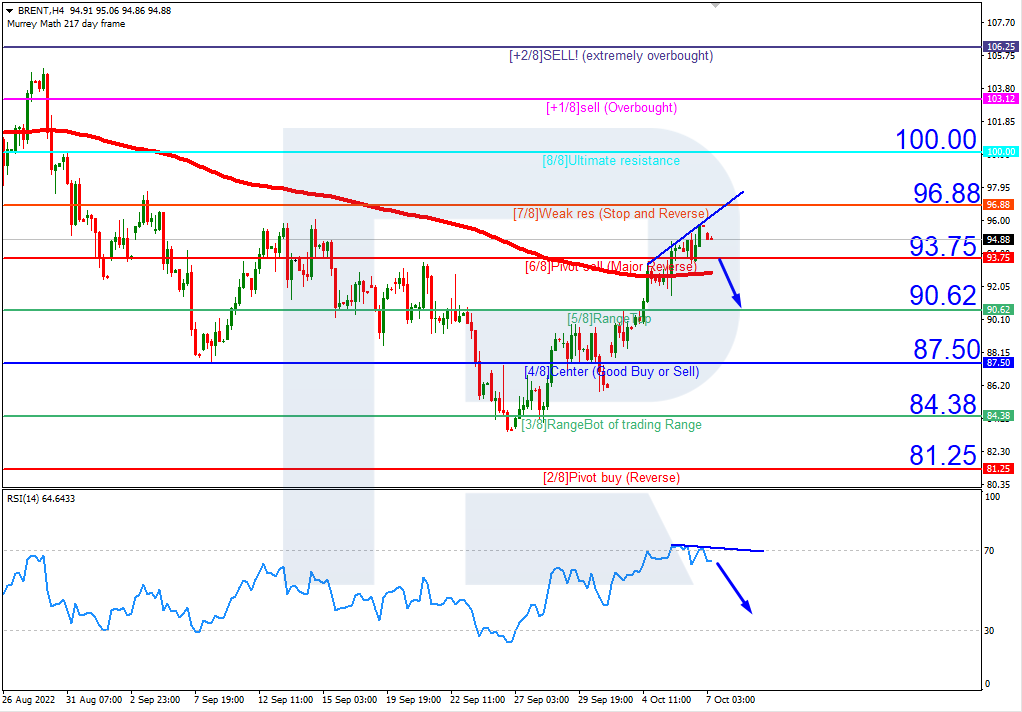
As we can see in the H4 chart, after breaking the 200-day Moving Average, Brent is trading above it to indicate a possible ascending tendency. However, there is divergence on the Relative Strength Index, which is a signal in favour of decline. In this case, the pair is expected to break 6/8 (93.75) and continue falling towards the support at 5/8 (90.62). However, this scenario may be cancelled if the price breaks the resistance at 7/8 (96.88) to the upside. After that, the instrument may move upwards to reach 8/8 (100.00).

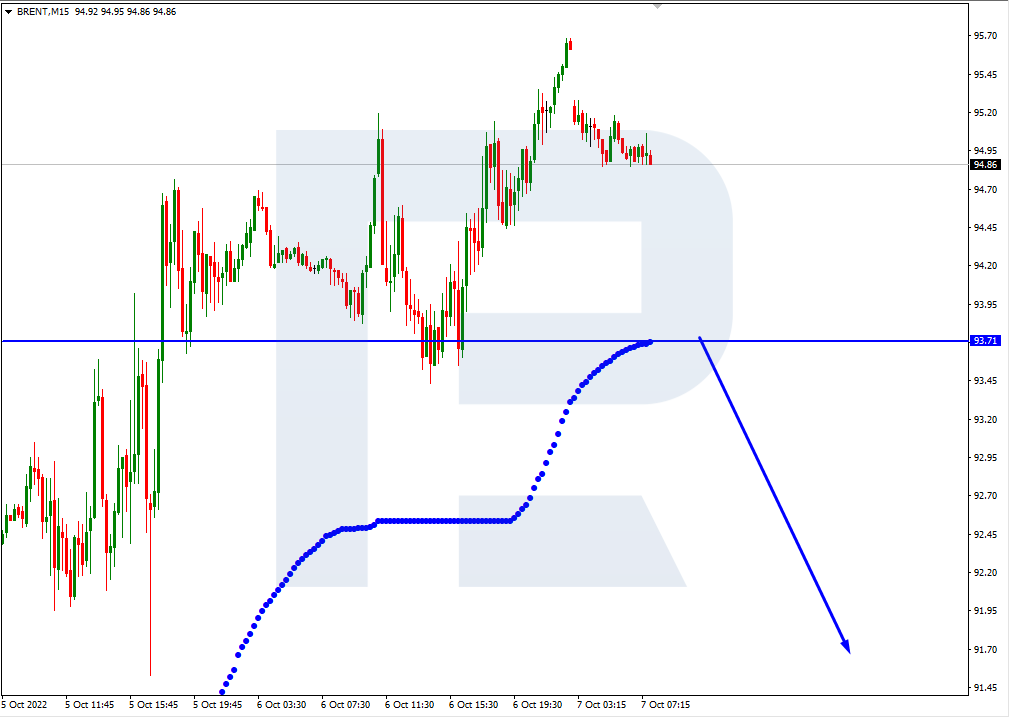
In the M15 chart, the pair may break the downside line of the VoltyChannel indicator and, as a result, continue its decline.
Free Reports:
 Sign Up for Our Stock Market Newsletter – Get updated on News, Charts & Rankings of Public Companies when you join our Stocks Newsletter
 Get our Weekly Commitment of Traders Reports - See where the biggest traders (Hedge Funds and Commercial Hedgers) are positioned in the futures markets on a weekly basis.
S&P 500
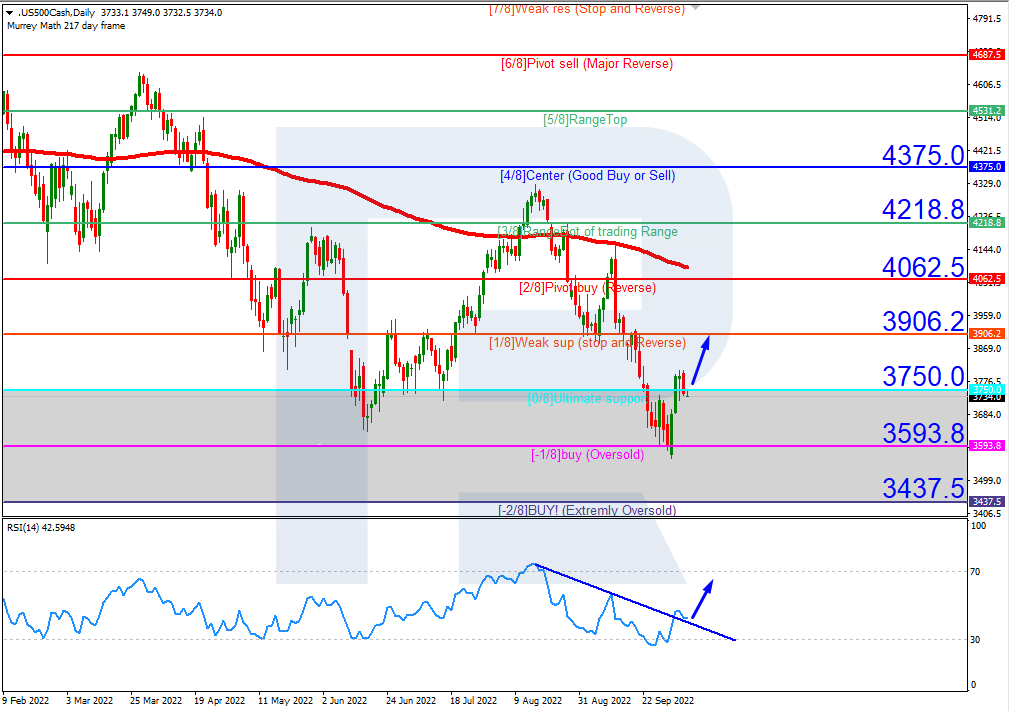
As we can see in the H4 chart, the S&P 500 index is trading inside the “oversold area”. The Relative Strength Index has broken the descending trendline to the upside. In this case, the price is expected to break 0/8 (3750.0) and continue moving upwards to reach the resistance at 1/8 (3906.2). However, this scenario may no longer be valid if the price breaks the support at -1/8 (3593.8) to the downside. After that, the instrument may continue to fall towards -2/8 (3437.5).
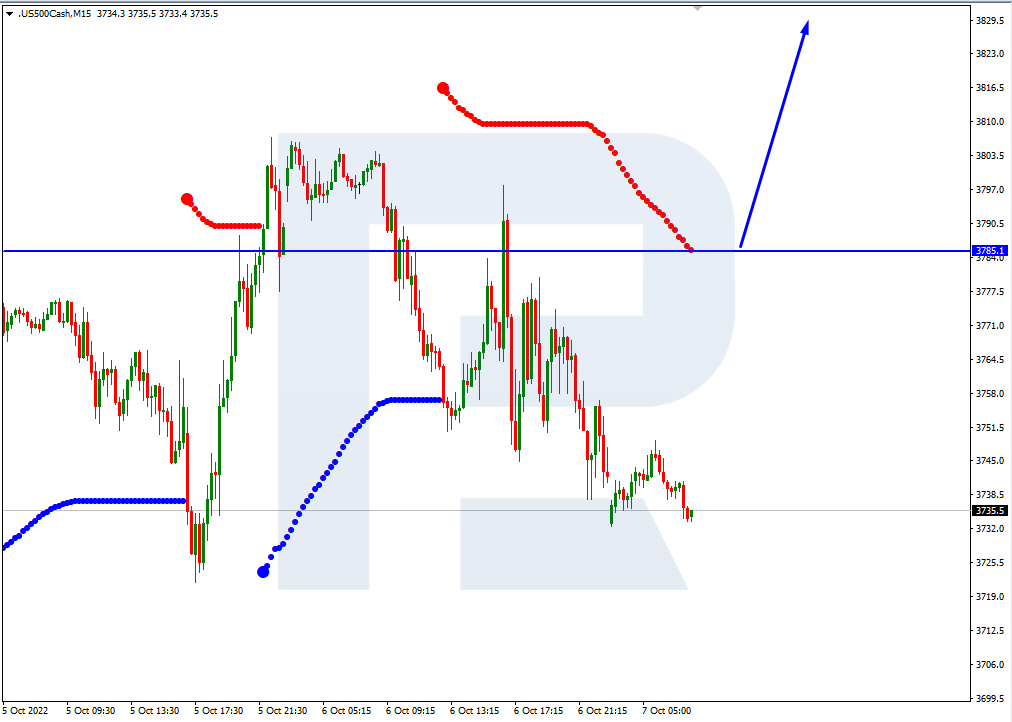
In the M15 chart, the pair may break the upside line of the VoltyChannel indicator and, as a result, continue trading upwards.
Article By RoboForex.com
Attention!
Forecasts presented in this section only reflect the author’s private opinion and should not be considered as guidance for trading. RoboForex LP bears no responsibility for trading results based on trading recommendations described in these analytical reviews.

- Investors run to safe-haven assets amid Middle East escalation Mar 6, 2026
- EUR/USD Under Pressure: Middle East Risks Outweigh All Else Mar 6, 2026
- Bitcoin shows resilience to Middle East events. Oil market stabilizes Mar 5, 2026
- GBP/USD: Market Not Expecting BoE Rate Cut in March Mar 5, 2026
- Brent headed for $100? Mar 4, 2026
- Global stock indices continue sell-off due to Middle East conflict Mar 4, 2026
- USD/JPY to Quickly Return to Growth: Momentum Favours the US Dollar Mar 4, 2026
- European equities plunge amid Persian Gulf military conflict Mar 3, 2026
- Gold Rallies for Fifth Day, With External Risks Mounting Mar 3, 2026
- Iran Crisis: A Dangerous Turning Point Mar 2, 2026