
Article By RoboForex.com
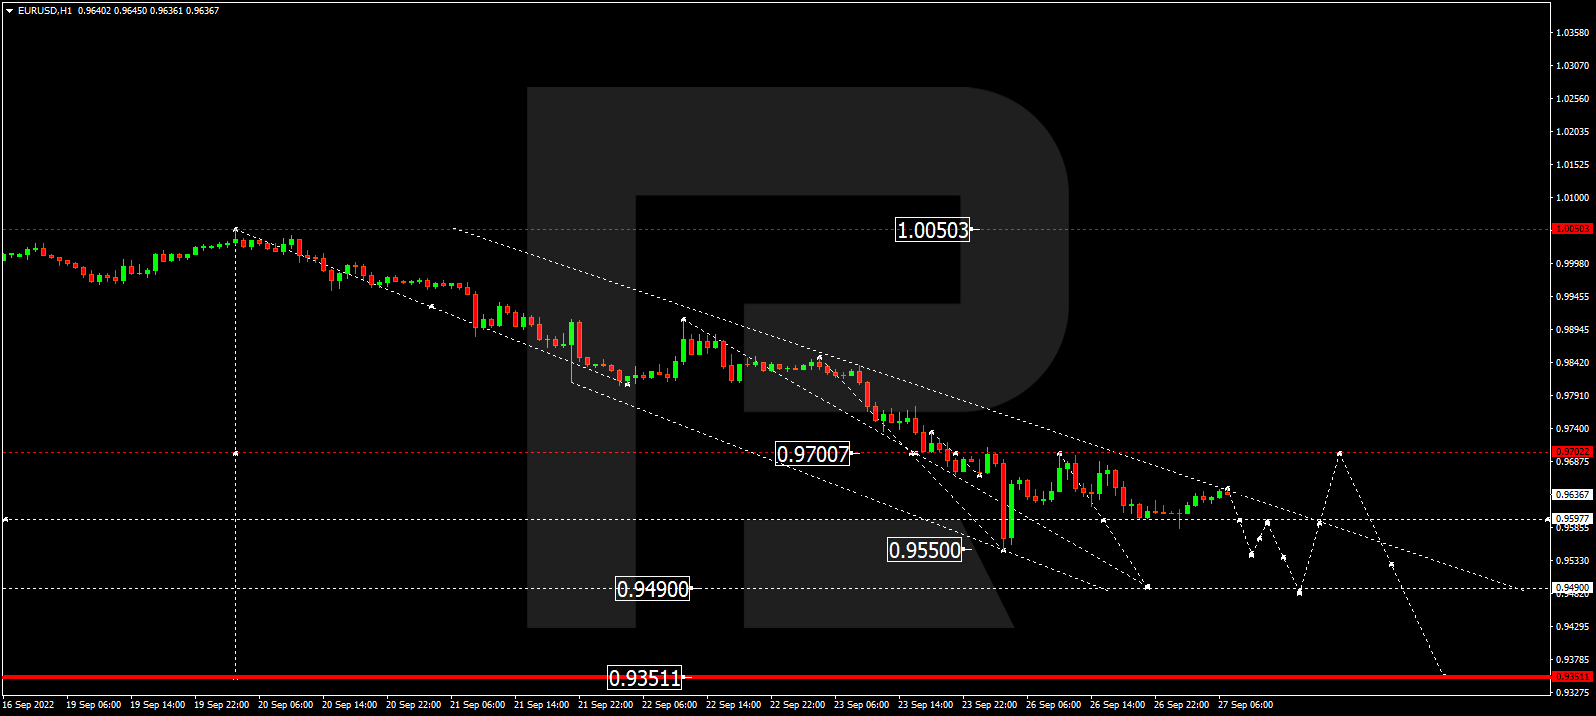
EURUSD, “Euro vs US Dollar”
After completing the descending wave at 0.9550 along with the correction up to 0.9700, EURUSD has formed another descending structure towards 0.9538 with one more correction up to 0.9645. Today, the pair may resume trading downwards with the target at 0.9490.

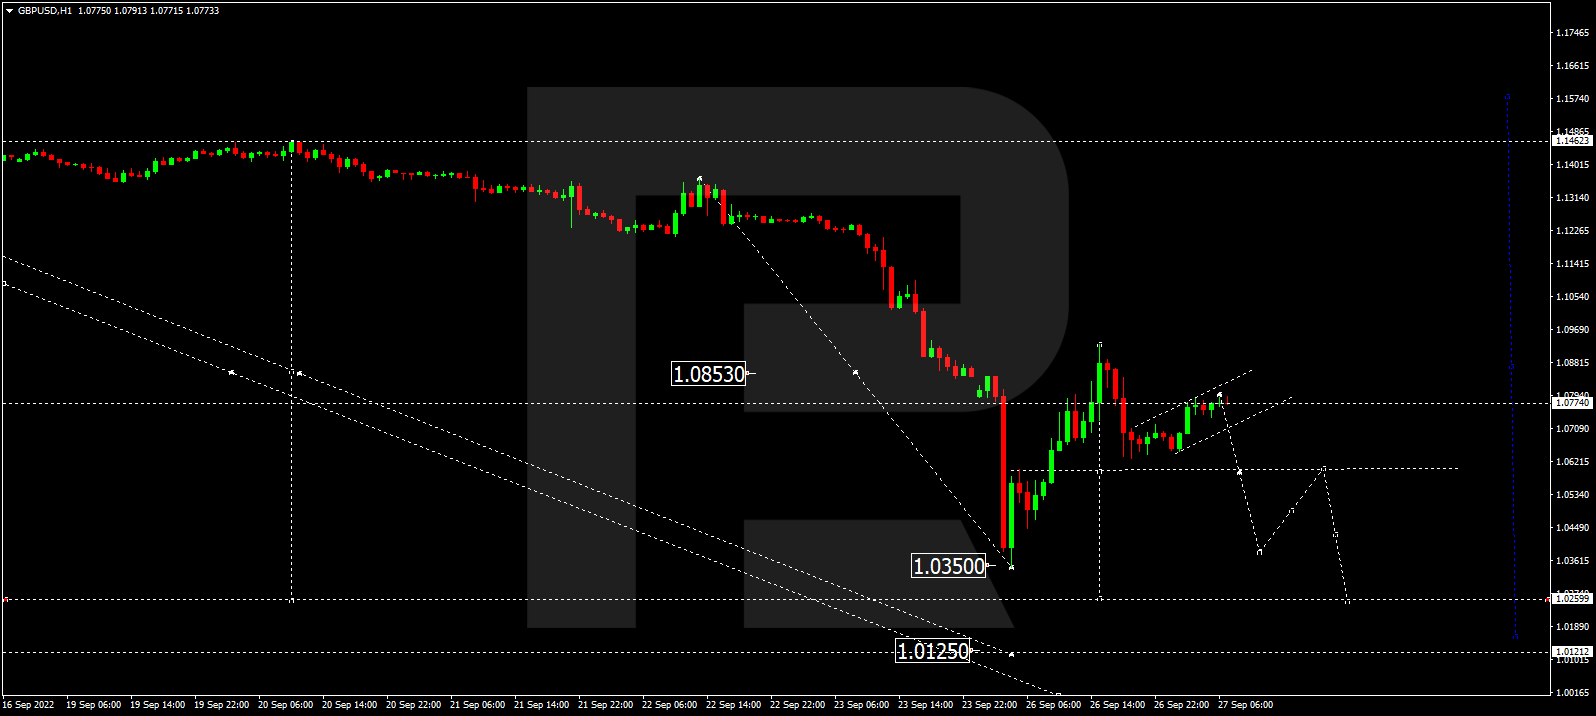
GBPUSD, “Great Britain Pound vs US Dollar”
After finishing the descending wave at 1.0344 along with the correction up to 1.0860, GBPUSD has formed another descending structure towards 1.0639 with one more correction up to 1.0774. Possibly, the pair may break the correctional channel and then resume trading downwards with the target at 1.0263.
Free Reports:
 Sign Up for Our Stock Market Newsletter – Get updated on News, Charts & Rankings of Public Companies when you join our Stocks Newsletter
 Get our Weekly Commitment of Traders Reports - See where the biggest traders (Hedge Funds and Commercial Hedgers) are positioned in the futures markets on a weekly basis.
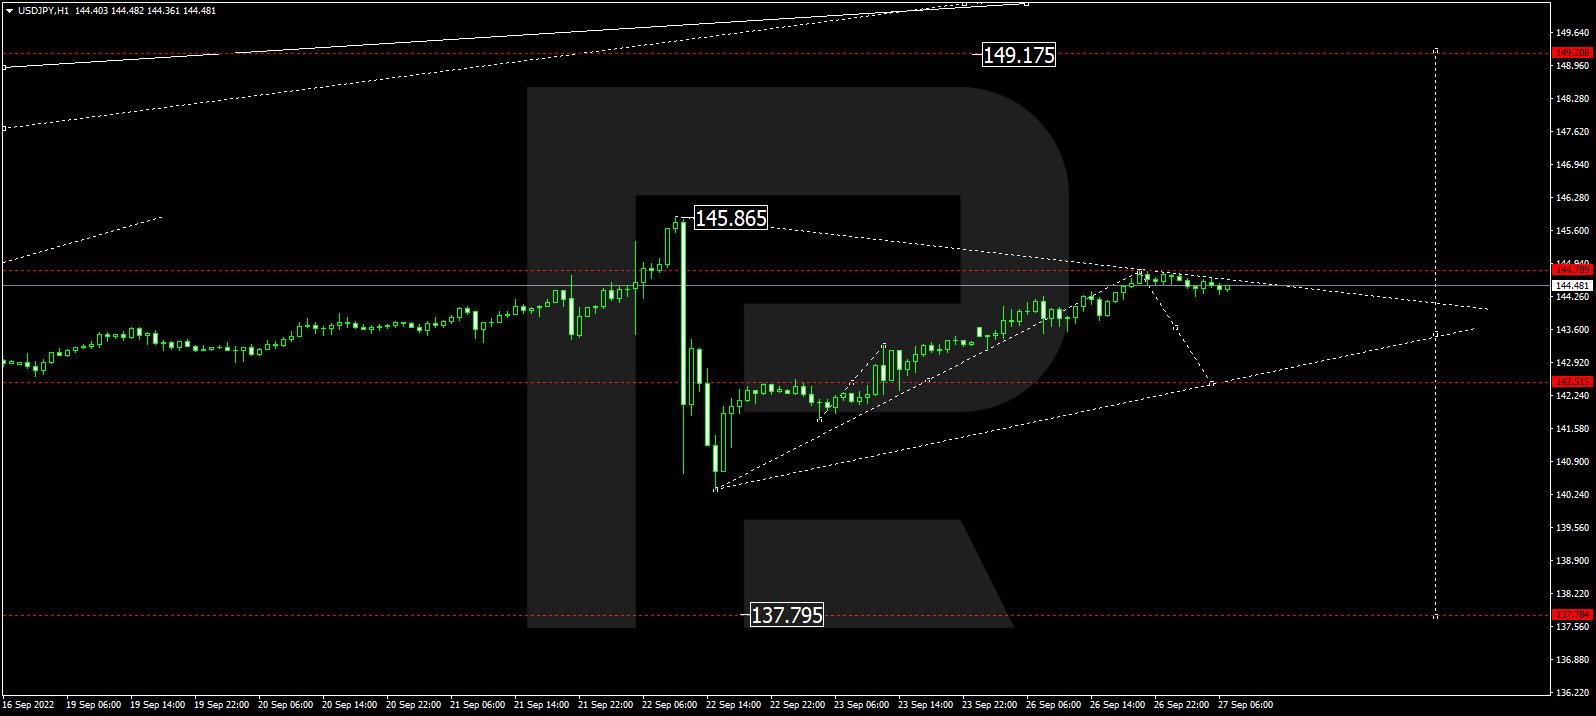
USDJPY, “US Dollar vs Japanese Yen”
USDJPY has completed the ascending wave at 144.78. Possibly, today the pair may correct down to 142.52 and then resume growing with the target at 149.17.
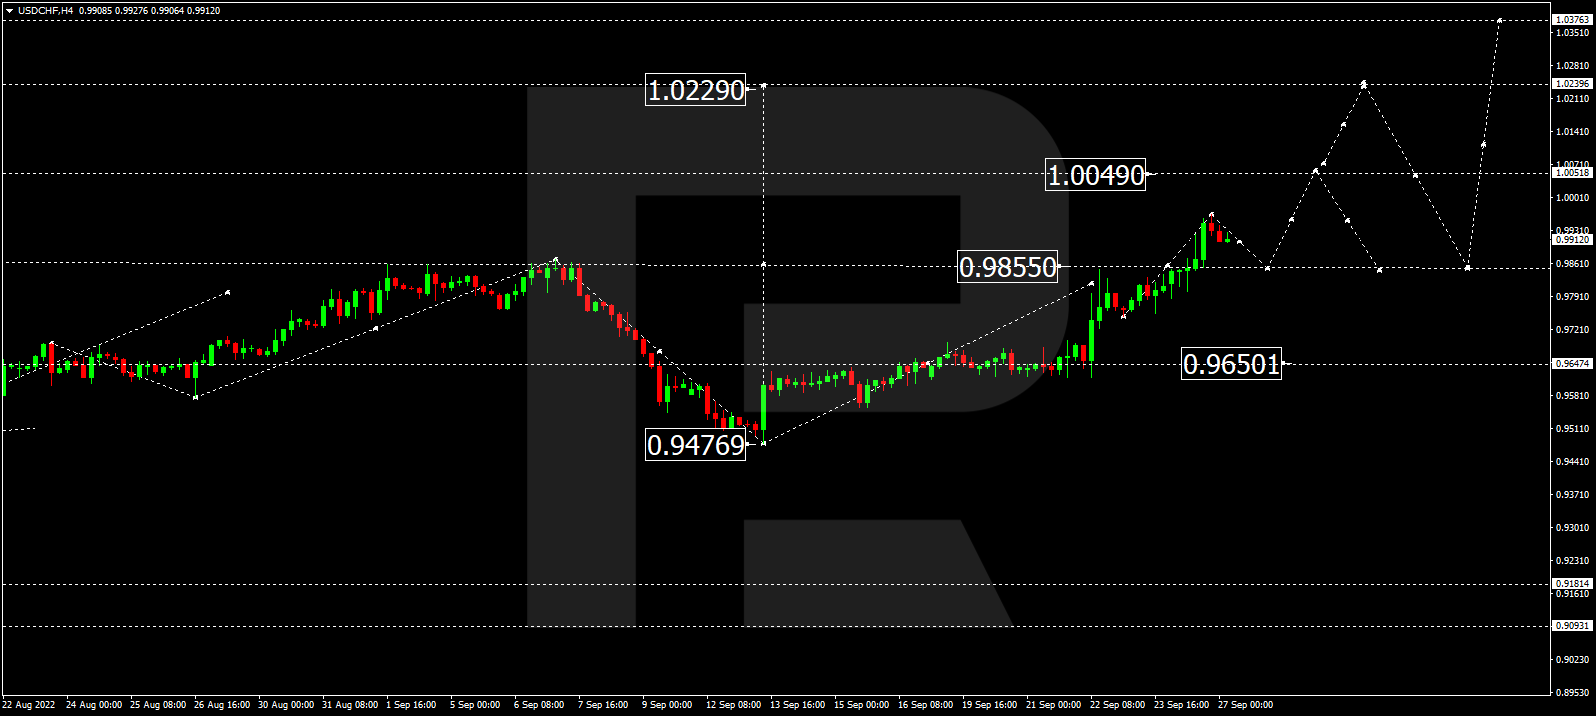
USDCHF, “US Dollar vs Swiss Franc”
Having finished the ascending wave at 0.9964, USDCHF is expected to fall towards 0.9866. Later, the market may resume trading upwards with the target at 1.0050, or even extend this structure up to 1.0240.
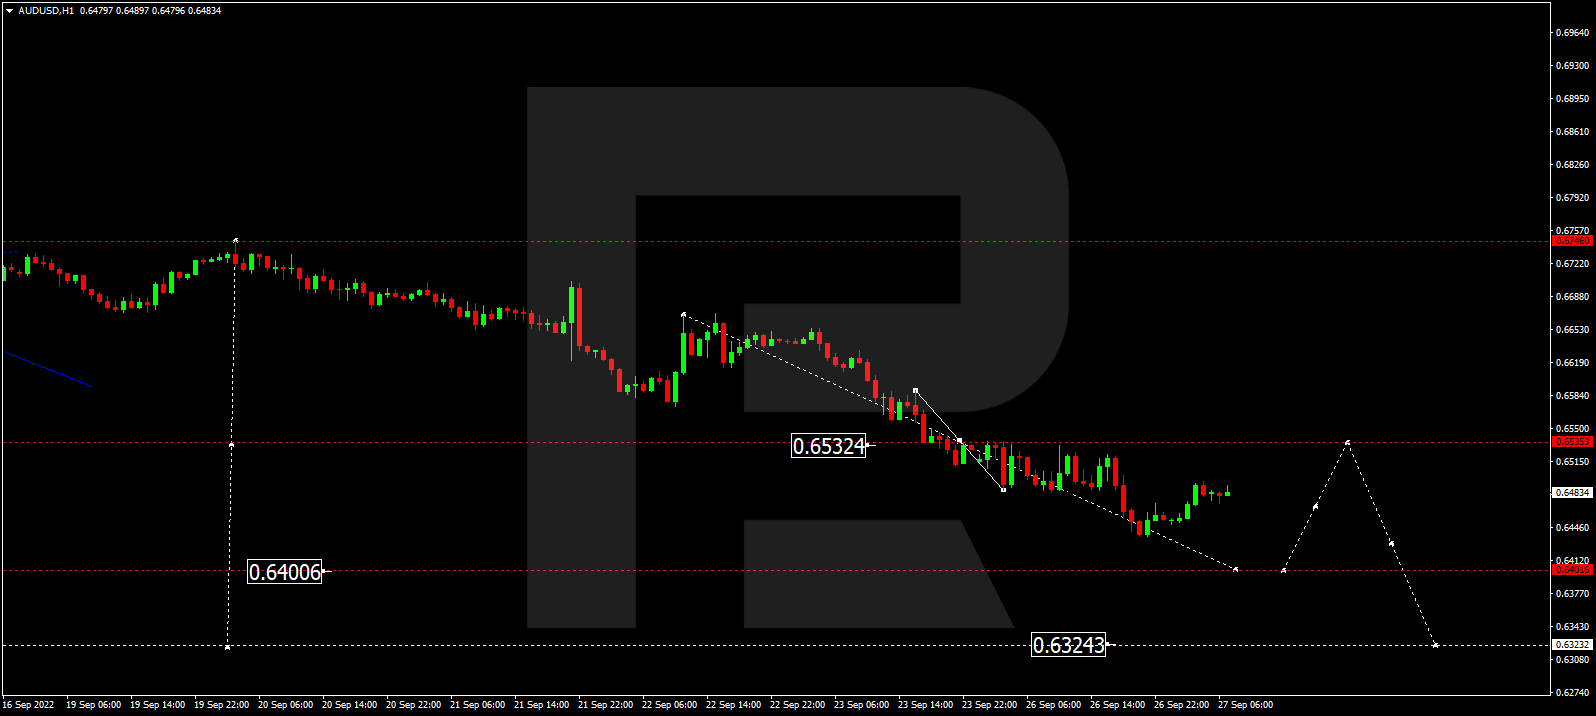
AUDUSD, “Australian Dollar vs US Dollar”
AUDUSD continues falling towards 0.6400. After that, the instrument may correct up to 0.6535 and then resume trading downwards with the target at 0.6324.
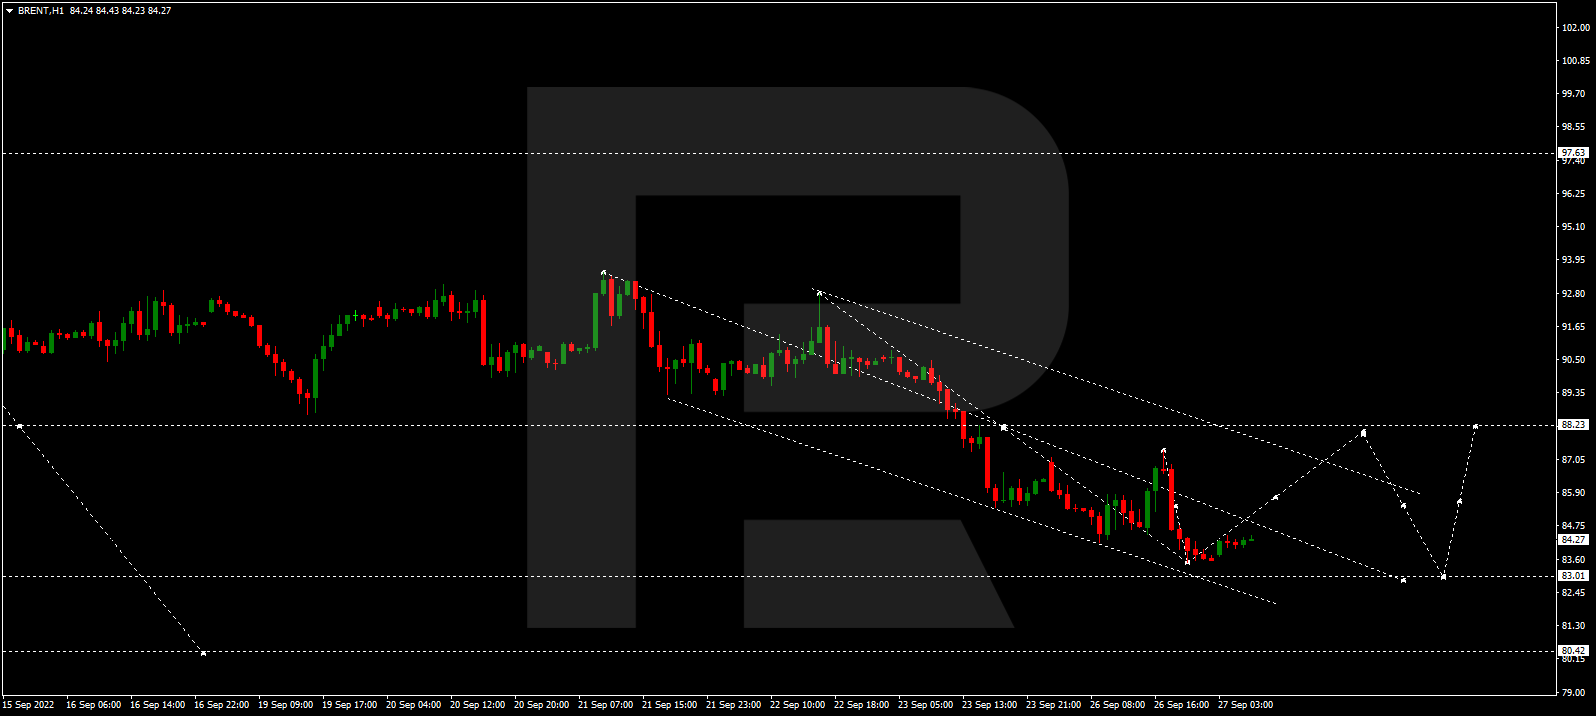
BRENT
After finishing the descending wave at 83.50, Brent is expected to form one more ascending structure towards 88.00. Later, the market may start another decline to return to 83.00 and then resume trading upwards with the target at 97.00.
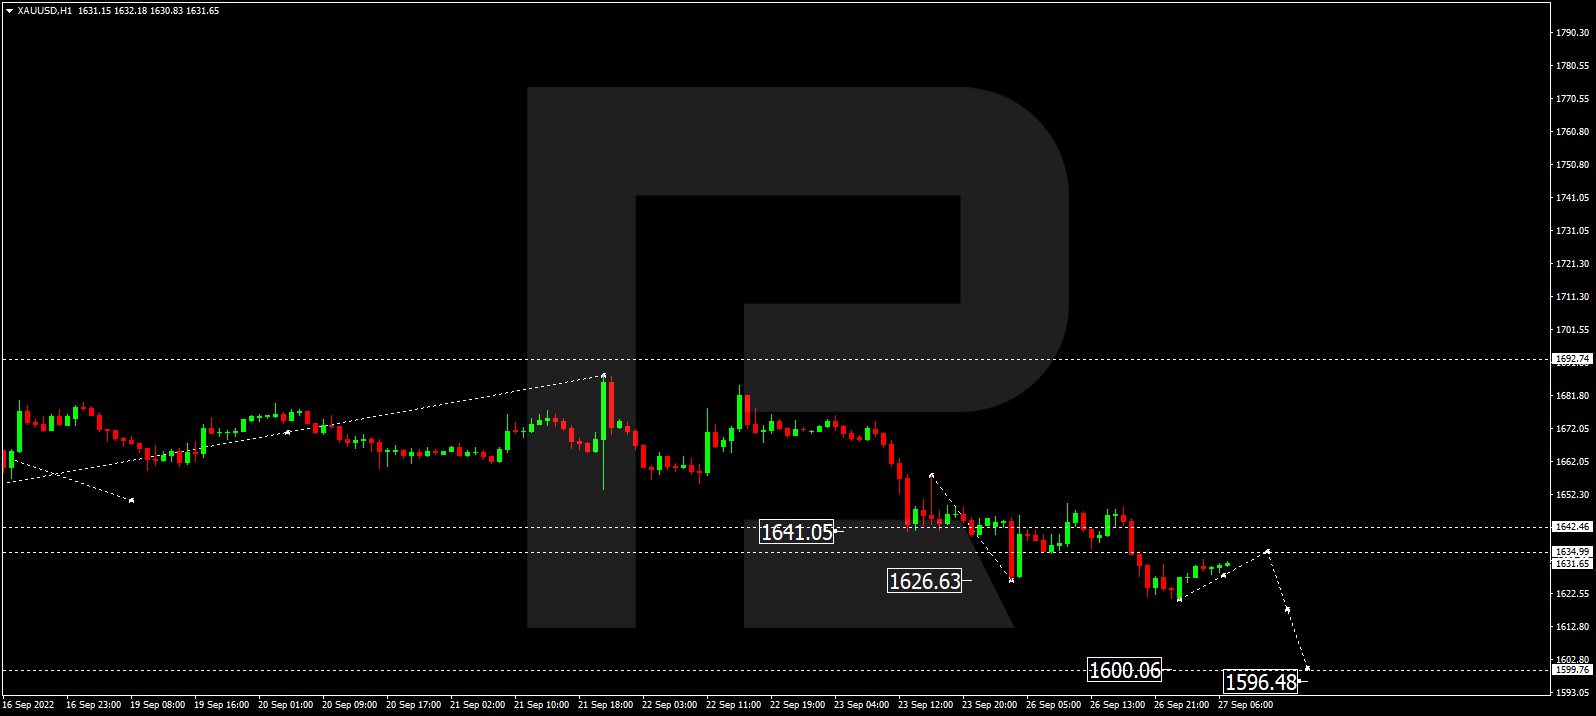
XAUUSD, “Gold vs US Dollar”
After completing the descending wave at 1621.00, Gold is correcting down to 1635.00. Later, the market may form another descending structure towards 1600.00 and then start a new growth with the target at 1692.70.
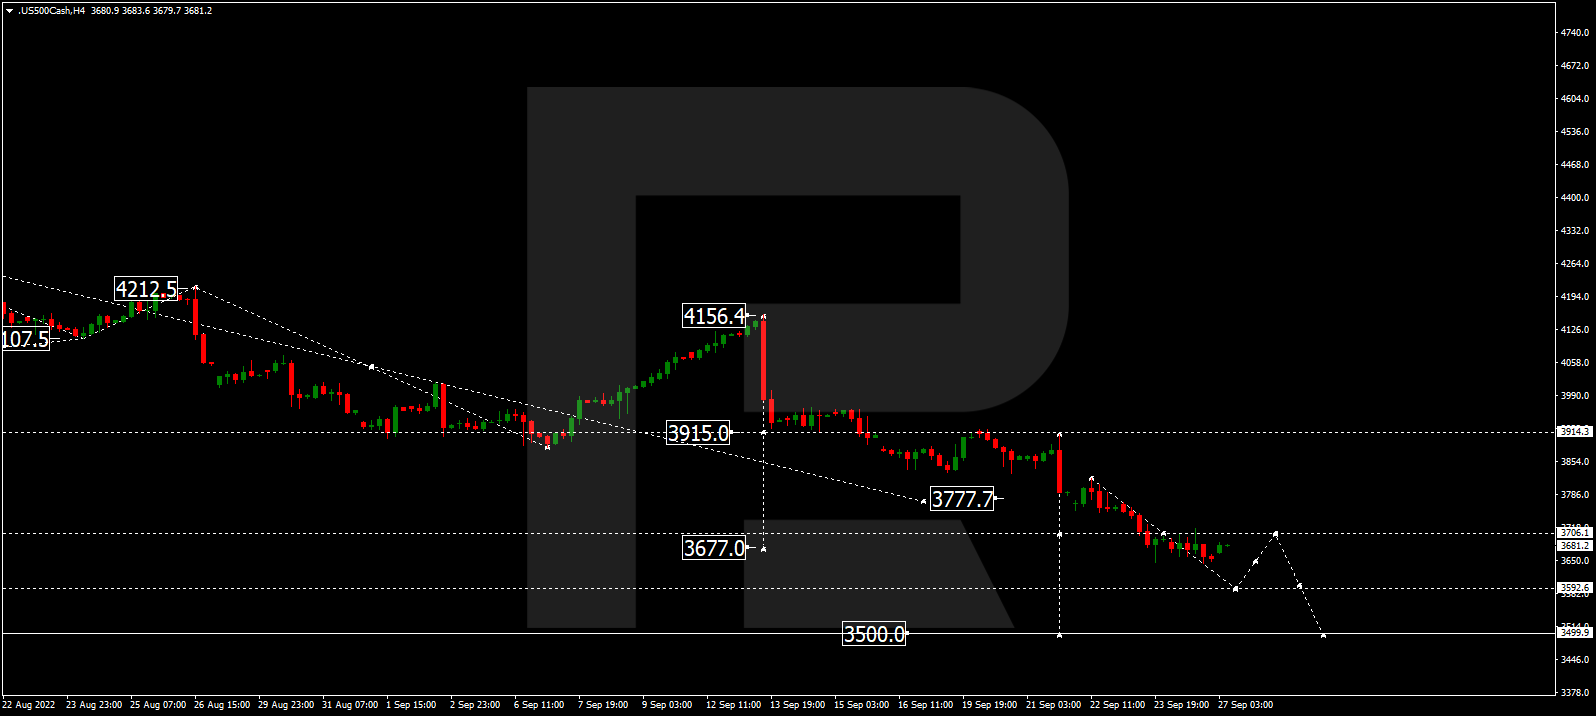
S&P 500
The S&P index has finished the descending wave at 3644.0; right now, it is consolidating there. Today, the asset may break the range to the downside and resume falling towards 3592.5, or even extend this structure down to 3500.0.
Article By RoboForex.com
Attention!
Forecasts presented in this section only reflect the author’s private opinion and should not be considered as guidance for trading. RoboForex LP bears no responsibility for trading results based on trading recommendations described in these analytical reviews.

- COT Metals Charts: Speculator Bets led by Silver, Gold & Platinum Mar 7, 2026
- COT Bonds Charts: Speculator Bets led by 10-Year Bonds & Fed Funds Mar 7, 2026
- COT Energy Charts: Speculator Bets led by Brent Oil & Heating Oil Mar 7, 2026
- COT Soft Commodities Charts: Speculator Bets led by Corn & Soybean Meal Mar 7, 2026
- Investors run to safe-haven assets amid Middle East escalation Mar 6, 2026
- EUR/USD Under Pressure: Middle East Risks Outweigh All Else Mar 6, 2026
- Bitcoin shows resilience to Middle East events. Oil market stabilizes Mar 5, 2026
- GBP/USD: Market Not Expecting BoE Rate Cut in March Mar 5, 2026
- Brent headed for $100? Mar 4, 2026
- Global stock indices continue sell-off due to Middle East conflict Mar 4, 2026