
Article By RoboForex.com
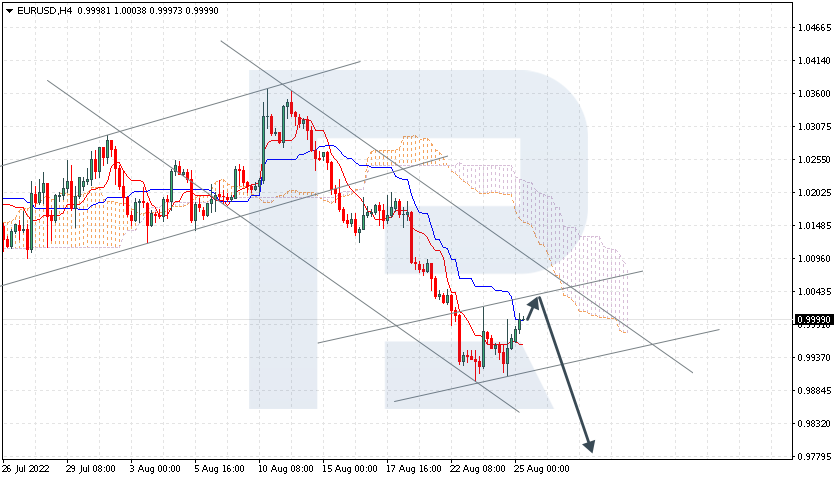
EURUSD, “Euro vs US Dollar”
EURUSD is rebounding from Kijun-Sen. The instrument is currently moving below Ichimoku Cloud, thus indicating a descending tendency. The markets could indicate that the price may test the bullish channel’s upside border at 1.0040 and then resume moving downwards to reach 0.9780. Another signal in favour of a further downtrend will be a rebound from the descending channel’s upside border. However, the bearish scenario may no longer be valid if the price breaks the cloud’s upside border and fixes above 1.0165. In this case, the pair may continue growing towards 1.0250. To confirm a further downtrend, the price must break the bullish channel’s downside border and fix below 0.9985.

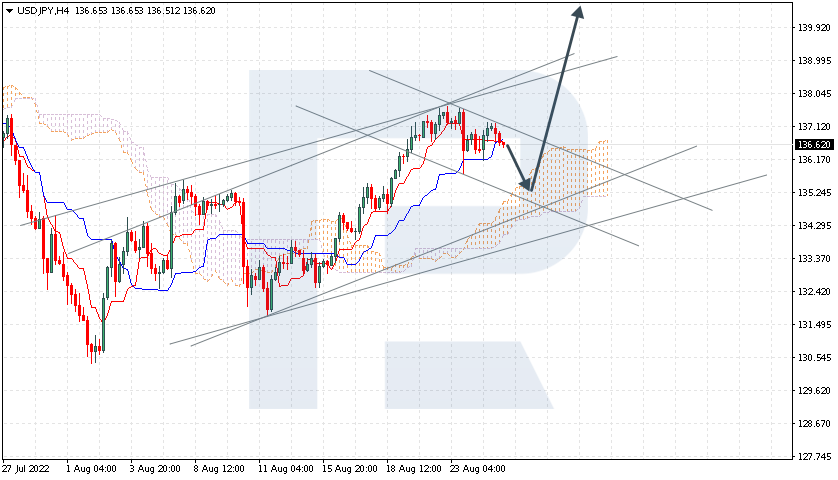
USDJPY, “US Dollar vs Japanese Yen”
USDJPY is testing Tenkan-Sen and Kijun-Sen. The instrument is currently moving above Ichimoku Cloud, thus indicating an ascending tendency. The markets could indicate that the price may test the cloud’s upside border at 133.25 and then resume moving upwards to reach 140.35. Another signal in favour of a further uptrend will be a rebound from the rising channel’s downside border. However, the bullish scenario may no longer be valid if the price breaks the cloud’s downside border and fixes below 133.45. In this case, the pair may continue falling towards 132.55. To confirm a further uptrend, the price must break the bearish channel’s upside border and fix above 137.45.
Free Reports:
 Get our Weekly Commitment of Traders Reports - See where the biggest traders (Hedge Funds and Commercial Hedgers) are positioned in the futures markets on a weekly basis.
 Sign Up for Our Stock Market Newsletter – Get updated on News, Charts & Rankings of Public Companies when you join our Stocks Newsletter
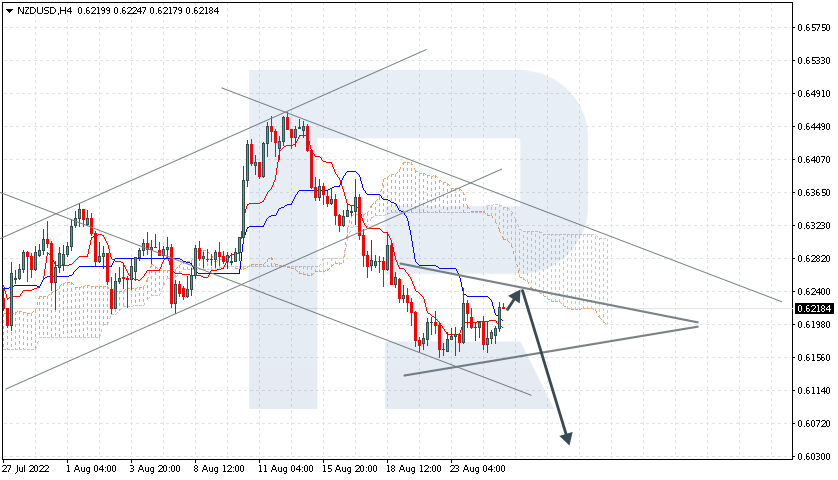
NZDUSD, “New Zealand Dollar vs US Dollar”
NZDUSD has fixed below the support area. The instrument is currently moving below Ichimoku Cloud, thus indicating a descending tendency. The markets could indicate that the price may test the cloud’s downside border at 0.6235 and then resume moving downwards to reach 0.6035. Another signal in favour of a further downtrend will be a rebound from the upside border of the Triangle pattern. However, the bearish scenario may no longer be valid if the price breaks the cloud’s upside border and fixes above 0.6355. In this case, the pair may continue growing towards 0.6445. To confirm a further downtrend, the price must break the pattern’s downside border and fix below 0.6135.
Article By RoboForex.com
Attention!
Forecasts presented in this section only reflect the author’s private opinion and should not be considered as guidance for trading. RoboForex LP bears no responsibility for trading results based on trading recommendations described in these analytical reviews.

- COT Metals Charts: Speculator Bets led by Silver, Gold & Platinum Mar 7, 2026
- COT Bonds Charts: Speculator Bets led by 10-Year Bonds & Fed Funds Mar 7, 2026
- COT Energy Charts: Speculator Bets led by Brent Oil & Heating Oil Mar 7, 2026
- COT Soft Commodities Charts: Speculator Bets led by Corn & Soybean Meal Mar 7, 2026
- Investors run to safe-haven assets amid Middle East escalation Mar 6, 2026
- EUR/USD Under Pressure: Middle East Risks Outweigh All Else Mar 6, 2026
- Bitcoin shows resilience to Middle East events. Oil market stabilizes Mar 5, 2026
- GBP/USD: Market Not Expecting BoE Rate Cut in March Mar 5, 2026
- Brent headed for $100? Mar 4, 2026
- Global stock indices continue sell-off due to Middle East conflict Mar 4, 2026