
By RoboForex Analytical Department
The commodity market suffered another stress last week. On Monday, the situation reached stability, but it remains quite complicated; Brent is trading at $95.60.
The asset closed last trading week near its 5-month lows.
The key reason for these negative vibes is the same’ global expectations of a worldwide recession. Economic slumps all over the world will eventually lead to a decline in demand for fuel, hence a drop in energy prices.
Another local factor that puts pressure on is the USD strengthening.
Last Friday’s report from Baker Hughes showed that over the past week, the Oil Rig Count in the US lost 7 units, down to 598. In Canada, the indicator increased by 3 units, up to 140. Shale oil companies are in no hurry to invest more money in production.
Free Reports:
 Get our Weekly Commitment of Traders Reports - See where the biggest traders (Hedge Funds and Commercial Hedgers) are positioned in the futures markets on a weekly basis.
 Sign Up for Our Stock Market Newsletter – Get updated on News, Charts & Rankings of Public Companies when you join our Stocks Newsletter
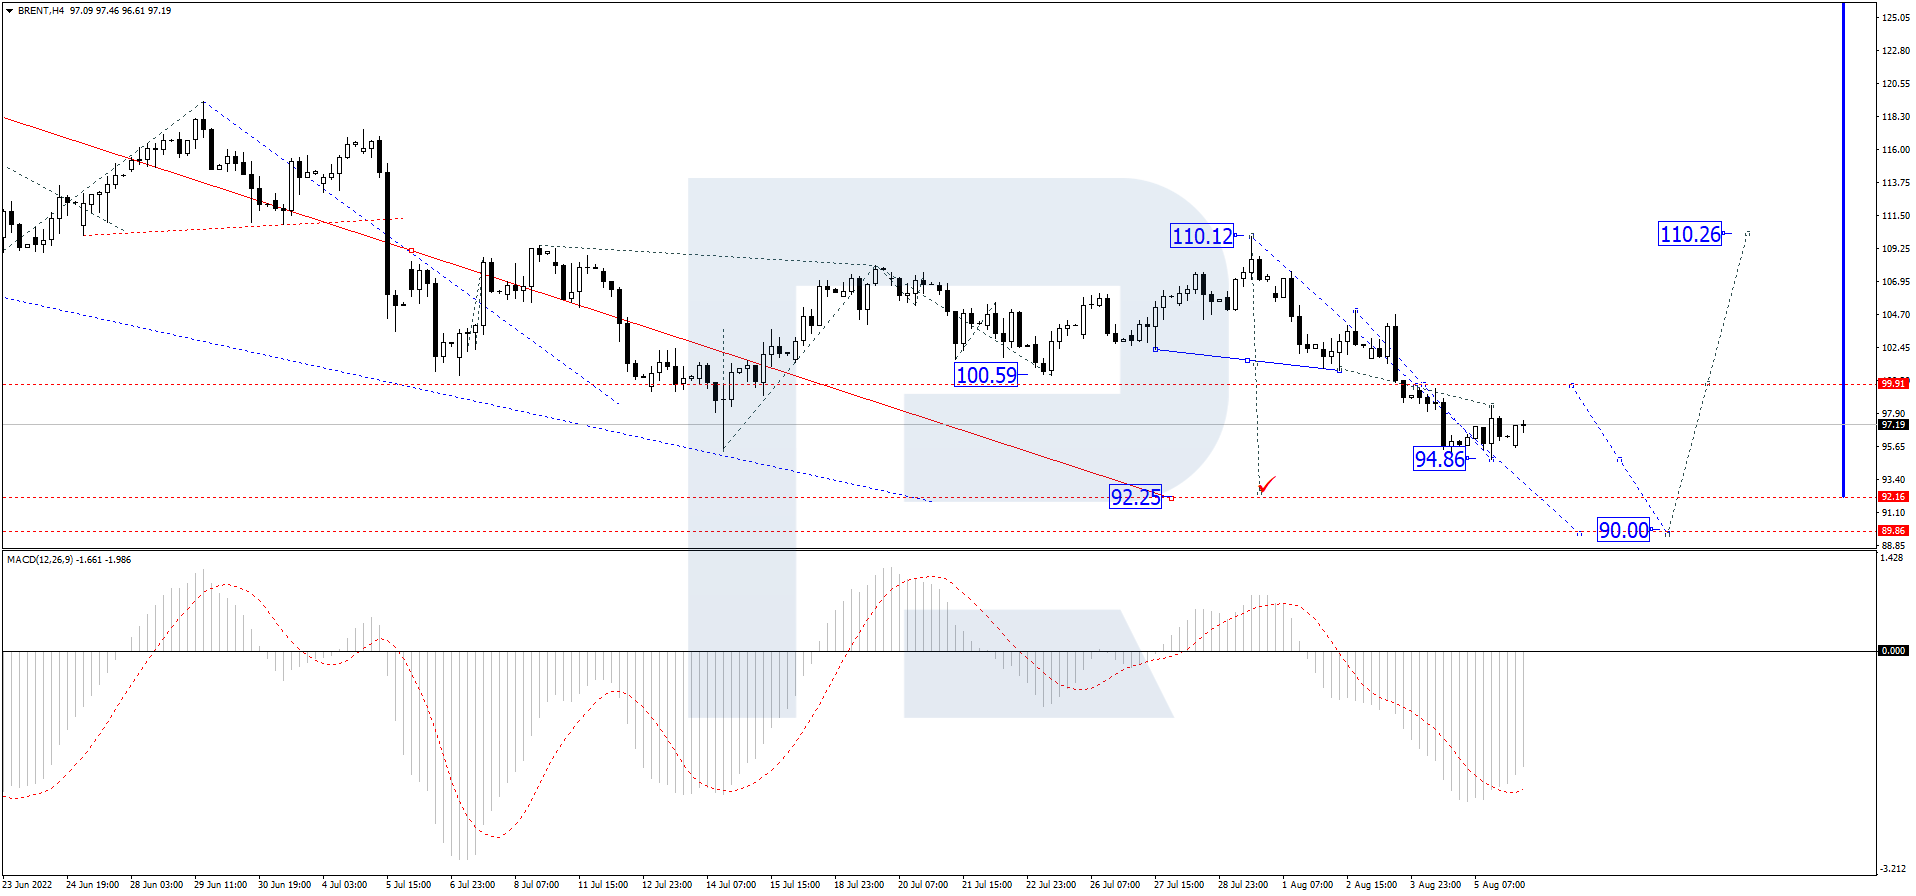
On the H4 chart, after breaking 100.00 downwards, Brent is still correcting and has already reached the short-term target at 94.80. Possibly, today the pair may form one more ascending structure to test 99.90 from below and then complete the descending wave by reaching 90.00. After that, the instrument may resume trading upwards with the target at 122.00. From the technical point of view, this scenario is confirmed by the MACD Oscillator: its signal line is moving near the lows outside the histogram area and may later grow to reach 0.
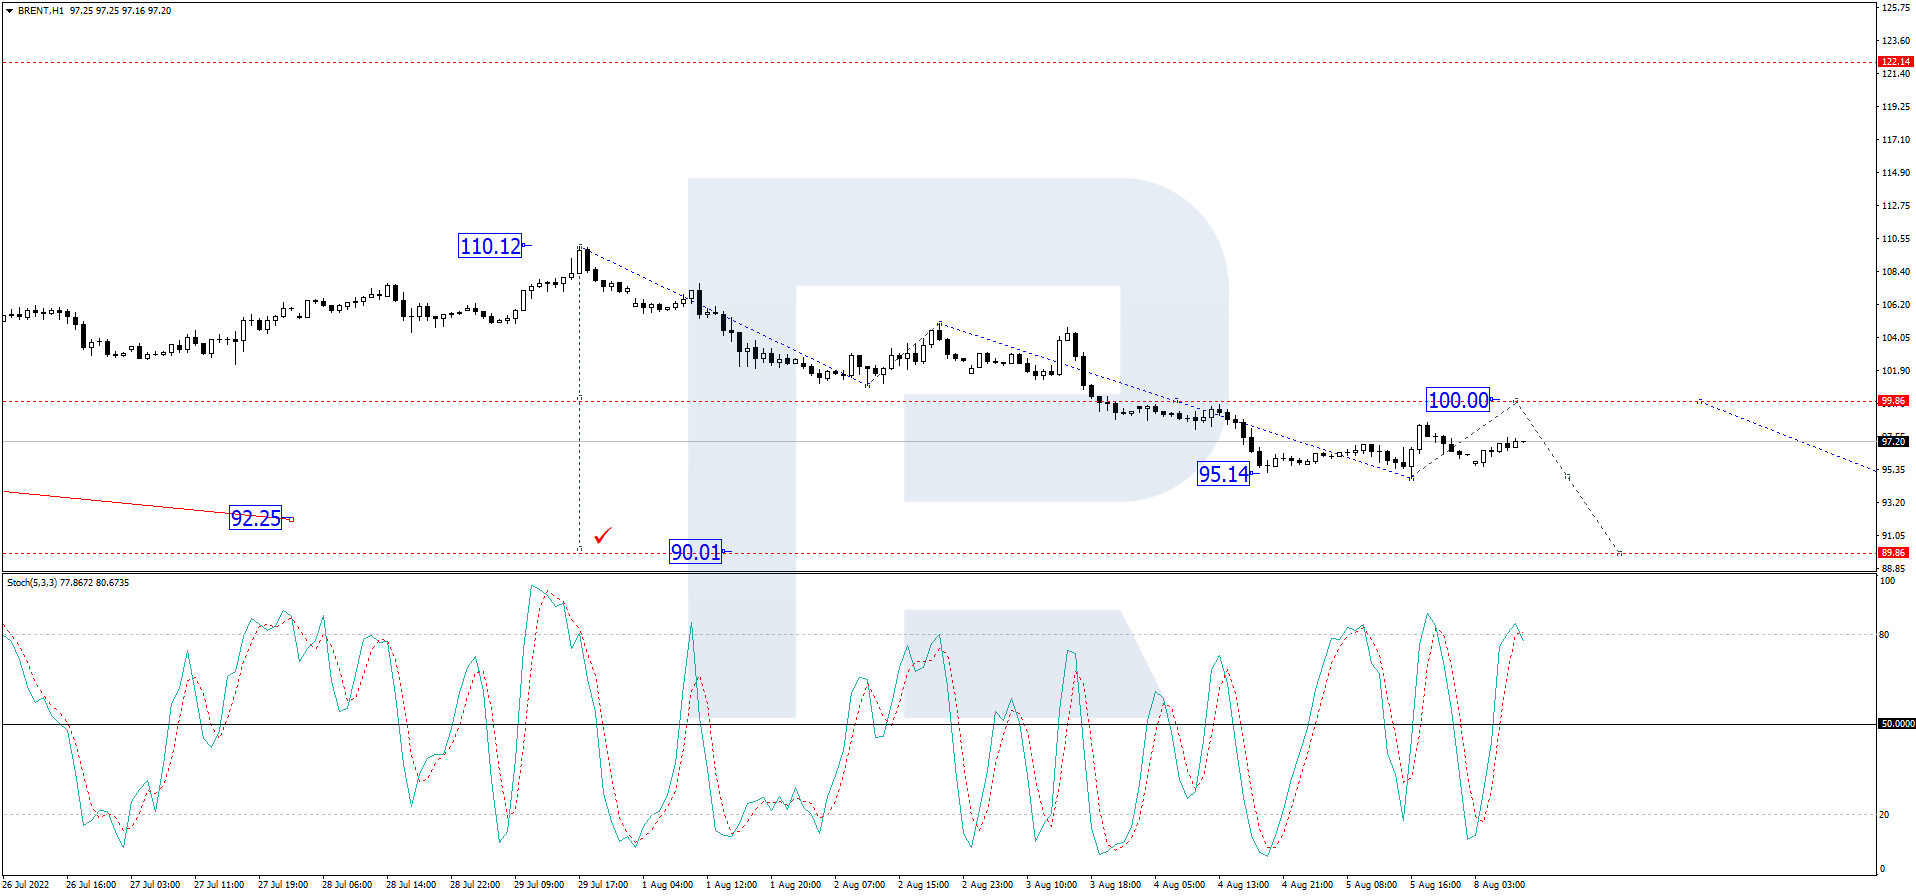
As we can see in the H1 chart, after finishing the descending correctional structure at 95.15, Brent is consolidating above this level. Possibly, the asset may break the range to the upside and start another growth with the target at 100.00. Later, the market may resume falling to reach 90.00. From the technical point of view, this idea is confirmed by the Stochastic Oscillator: its signal line is moving near the highs above 80. Later, the line may fall to break 50 and continue falling to reach 20.
Disclaimer
Any forecasts contained herein are based on the author’s particular opinion. This analysis may not be treated as trading advice. RoboForex bears no responsibility for trading results based on trading recommendations and reviews contained herein.

- Investors run to safe-haven assets amid Middle East escalation Mar 6, 2026
- EUR/USD Under Pressure: Middle East Risks Outweigh All Else Mar 6, 2026
- Bitcoin shows resilience to Middle East events. Oil market stabilizes Mar 5, 2026
- GBP/USD: Market Not Expecting BoE Rate Cut in March Mar 5, 2026
- Brent headed for $100? Mar 4, 2026
- Global stock indices continue sell-off due to Middle East conflict Mar 4, 2026
- USD/JPY to Quickly Return to Growth: Momentum Favours the US Dollar Mar 4, 2026
- European equities plunge amid Persian Gulf military conflict Mar 3, 2026
- Gold Rallies for Fifth Day, With External Risks Mounting Mar 3, 2026
- Iran Crisis: A Dangerous Turning Point Mar 2, 2026