
Article By RoboForex.com
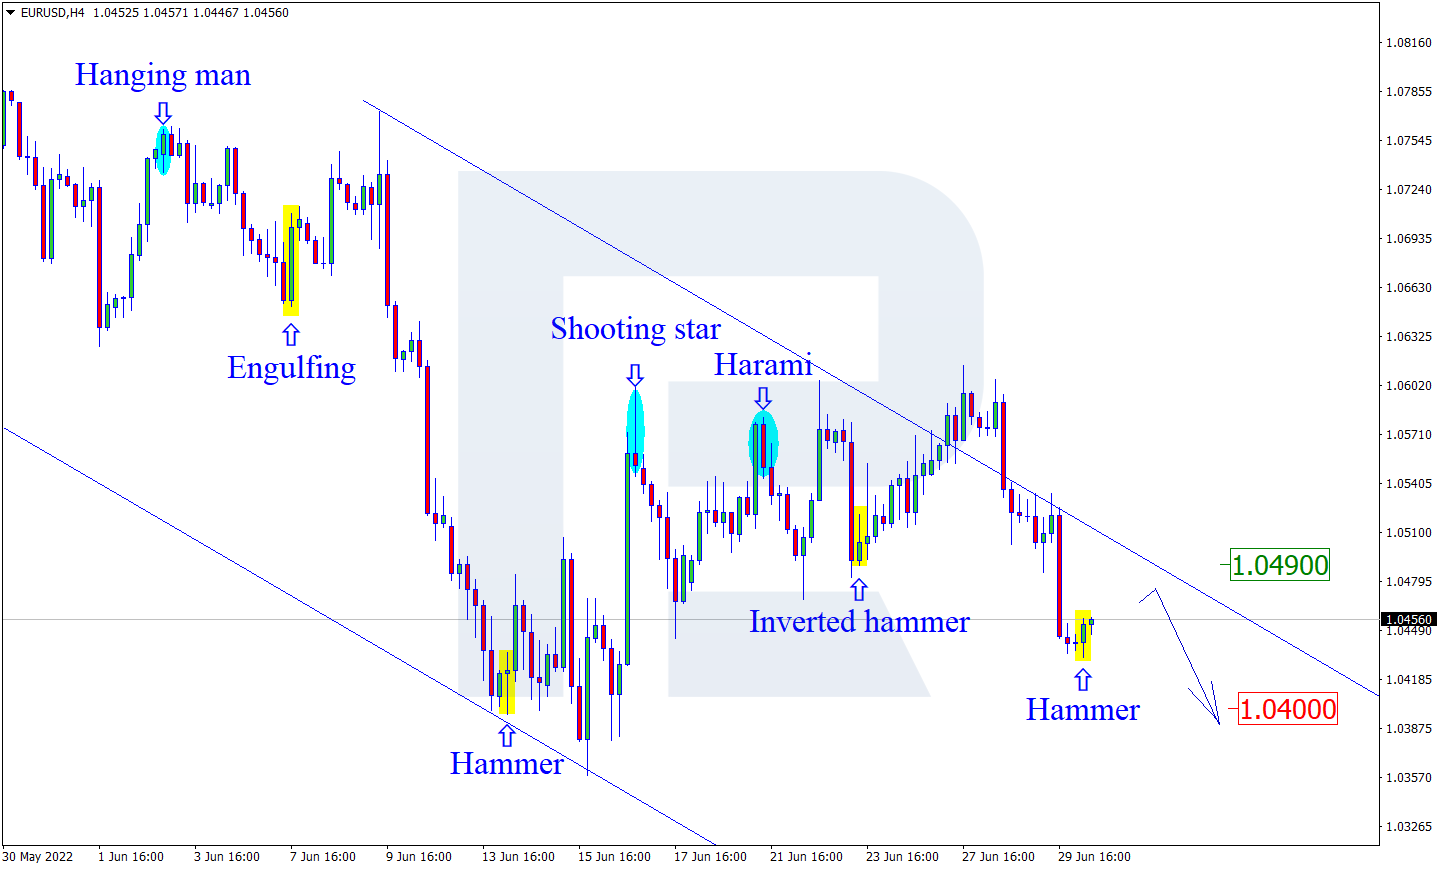
EURUSD, “Euro vs US Dollar”
As we can see in the H4 chart, the asset has formed a Hammer reversal pattern close to the support area. At the moment, EURUSD may reverse in the form of a new ascending impulse. In this case, the upside target may be at 1.0490. However, an alternative scenario implies that the price may fall to reach 1.0400 and continue the downtrend without testing 1.0490.

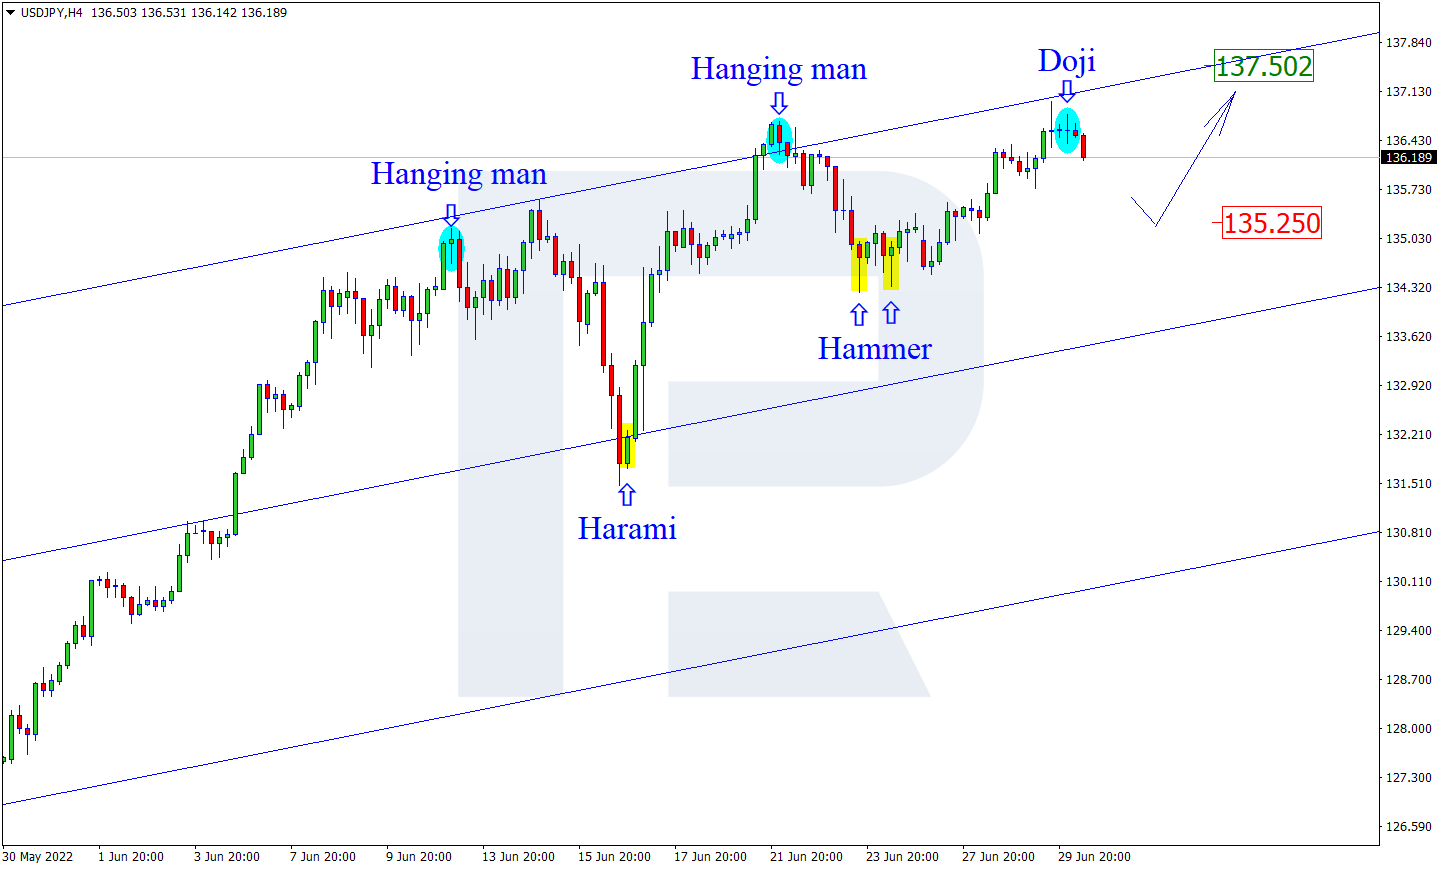
USDJPY, “US Dollar vs Japanese Yen”
As we can see in the H4 chart, USDJPY has formed several reversal patterns not far from the resistance area, such as Doji. At the moment, the asset is reversing in the form of a new descending impulse. In this case, the downside target may be at 135.25. At the same time, an opposite scenario implies that the price may grow to reach 137.50 and continue the uptrend without any pullbacks.
Free Reports:
 Sign Up for Our Stock Market Newsletter – Get updated on News, Charts & Rankings of Public Companies when you join our Stocks Newsletter
 Get our Weekly Commitment of Traders Reports - See where the biggest traders (Hedge Funds and Commercial Hedgers) are positioned in the futures markets on a weekly basis.
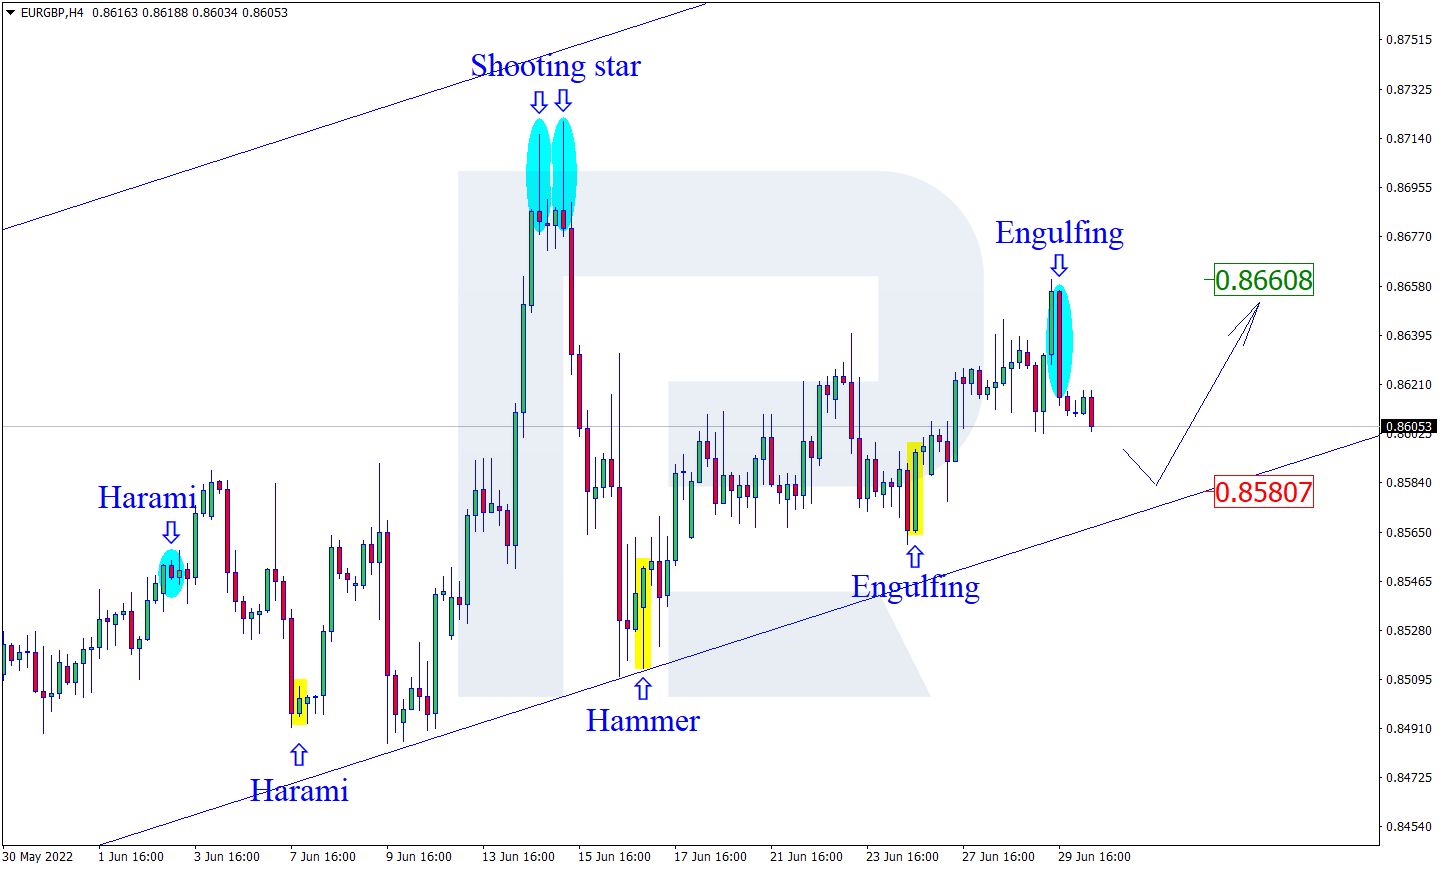
EURGBP, “Euro vs Great Britain Pound”
As we can see in the H4 chart, after forming an Engulfing pattern near the resistance area, EURGBP is reversing in the form of a new descending impulse. In this case, the downside correctional target may be the support level at 0.8580. Later, the market may test this level, rebound from it, and resume moving upwards. Still, there might be an alternative scenario, according to which the asset may grow to reach 0.8660 without any corrections.
Article By RoboForex.com
Attention!
Forecasts presented in this section only reflect the author’s private opinion and should not be considered as guidance for trading. RoboForex LP bears no responsibility for trading results based on trading recommendations described in these analytical reviews.

- COT Metals Charts: Speculator Bets led by Silver, Gold & Platinum Mar 7, 2026
- COT Bonds Charts: Speculator Bets led by 10-Year Bonds & Fed Funds Mar 7, 2026
- COT Energy Charts: Speculator Bets led by Brent Oil & Heating Oil Mar 7, 2026
- COT Soft Commodities Charts: Speculator Bets led by Corn & Soybean Meal Mar 7, 2026
- Investors run to safe-haven assets amid Middle East escalation Mar 6, 2026
- EUR/USD Under Pressure: Middle East Risks Outweigh All Else Mar 6, 2026
- Bitcoin shows resilience to Middle East events. Oil market stabilizes Mar 5, 2026
- GBP/USD: Market Not Expecting BoE Rate Cut in March Mar 5, 2026
- Brent headed for $100? Mar 4, 2026
- Global stock indices continue sell-off due to Middle East conflict Mar 4, 2026