By Orbex
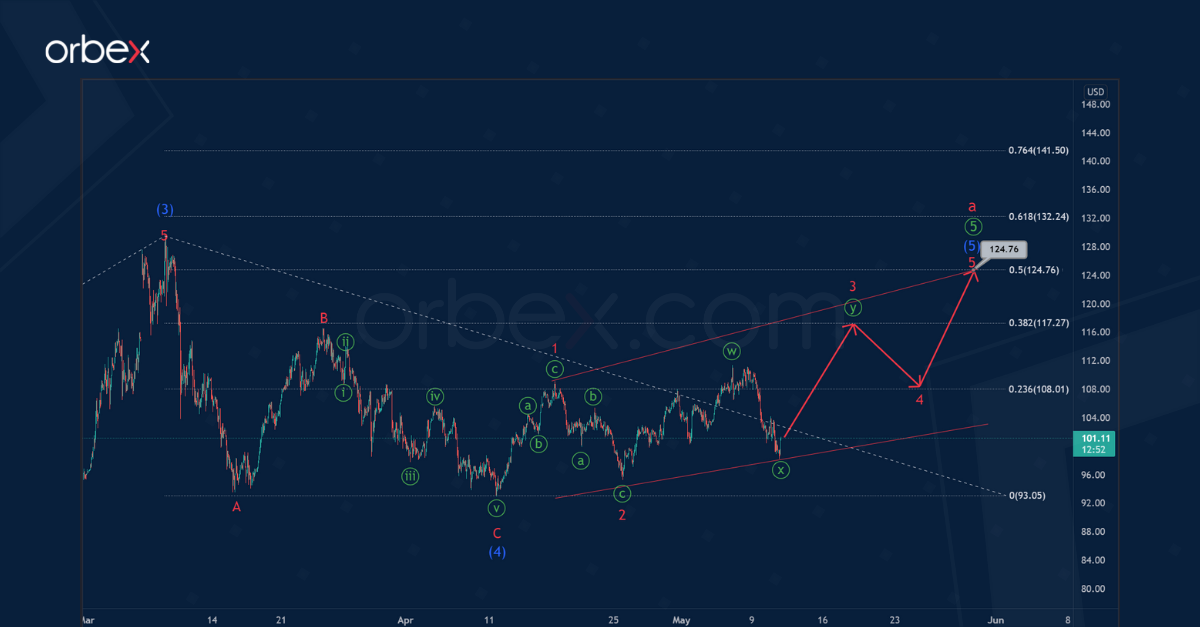
USOIL shows the development of the final part of the global impulse wave of the cycle degree. The final primary wave ⑤ takes the form of an intermediate impulse.
In early April, an intermediate correction wave (4) ended in the form of a minor zigzag. Prices then began to rise in the intermediate wave (5). We see that sub-waves 1 and 2 have a corrective structure. Thus, the entire wave (5) can take the form of an ending diagonal 1-2-3-4-5, as shown in the chart.
The end of this construction is possible near 124.76. At that level, wave (5) will be at the 50% Fibonacci extension of impulse (3). If this level is broken, prices could rise even higher to 132.24. At that level, wave (5) will be at 61.8% of impulse (3).

Free Reports:
 Get our Weekly Commitment of Traders Reports - See where the biggest traders (Hedge Funds and Commercial Hedgers) are positioned in the futures markets on a weekly basis.
 Download Our Metatrader 4 Indicators – Put Our Free MetaTrader 4 Custom Indicators on your charts when you join our Weekly Newsletter
Let’s consider an alternative scenario in which the construction of the intermediate correction (4) has not completed yet. Perhaps it will have a horizontal triple three W-X-Y-X-Z pattern.
The minor sub-waves W-X-Y-X look completed. A downward movement is now likely in the actionary sub-wave Z. This could take the form of a minute simple zigzag ⓐ-ⓑ-ⓒ.
Oil prices could fall to 90.39. At that level, intermediate correction (4) will be at 61.8% of impulse (3).
After the end of the sideways movement, the market is likely to grow above the maximum of 129.56.
Test your strategy on how oil will fare with Orbex – Open your account now.
![]() Article by Orbex
Article by Orbex
Orbex is a fully licensed broker that was established in 2011. Founded with a mission to serve its traders responsibly and provides traders with access to the world’s largest and most liquid financial markets. www.orbex.com

- Trump signals de-escalation in the Middle East; China’s trade surplus hits a new record Mar 10, 2026
- EUR/USD in Turbulence: Market Questions When Conflict Over Iran Will End Mar 10, 2026
- Prices push oil above $100 per barrel Mar 9, 2026
- COT Metals Charts: Speculator Bets led by Silver, Gold & Platinum Mar 7, 2026
- COT Bonds Charts: Speculator Bets led by 10-Year Bonds & Fed Funds Mar 7, 2026
- COT Energy Charts: Speculator Bets led by Brent Oil & Heating Oil Mar 7, 2026
- COT Soft Commodities Charts: Speculator Bets led by Corn & Soybean Meal Mar 7, 2026
- Investors run to safe-haven assets amid Middle East escalation Mar 6, 2026
- EUR/USD Under Pressure: Middle East Risks Outweigh All Else Mar 6, 2026
- Bitcoin shows resilience to Middle East events. Oil market stabilizes Mar 5, 2026