
By Orbex
USDJPY tests supply area

The Japanese yen stalled after an increase in January’s unemployment rate.
The pair’s rally above the supply zone around 115.80 has put the US dollar back on track. The general direction remains up despite its choppiness. 114.40 has proved to be solid support and kept the bulls in the game.
A close above 115.80 would extend the rally to the double top (116.30), a major resistance on the daily chart. Meanwhile, an overbought RSI caused a limited pullback, with 115.10 as fresh support.
NZDUSD breaks resistance

Free Reports:
 Download Our Metatrader 4 Indicators – Put Our Free MetaTrader 4 Custom Indicators on your charts when you join our Weekly Newsletter
 Get our Weekly Commitment of Traders Reports - See where the biggest traders (Hedge Funds and Commercial Hedgers) are positioned in the futures markets on a weekly basis.
The New Zealand dollar recovers amid commodity price rallies.
After the pair found support near last September’s lows (0.6530), a bullish MA cross on the daily chart suggests that sentiment could be turning around. A bullish breakout above the recent high (0.6810) would further boost buyers’ confidence and lift offers to January’s high at 0.6890.
On the downside, 0.6730 is the first support if buyers struggle to gather more interest. 0.6675 would be a second layer to keep the current rebound intact.
UK 100 lacks support
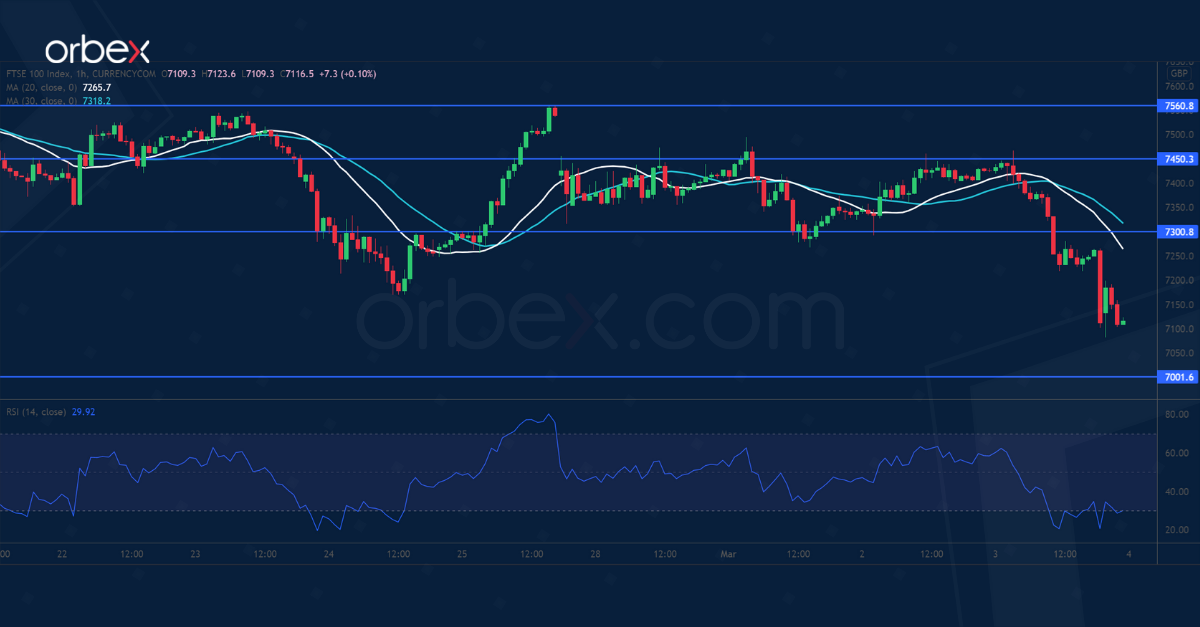
The FTSE 100 slipped after the second round of talks between Russia and Ukraine ended without much result.
The index met stiff selling pressure at 7560 then fell below the critical floor at 7170. Increasingly bearish sentiment triggered a new round of sell-off to the psychological level of 7000 from last November.
A deeper correction would lead to a retest of 6850, dampening the market mood in the medium-term. On the upside, the bulls must clear 7300 and 7450 to reclaim control of the direction.
![]() Article by Orbex
Article by Orbex
Orbex is a fully licensed broker that was established in 2011. Founded with a mission to serve its traders responsibly and provides traders with access to the world’s largest and most liquid financial markets. www.orbex.com

- COT Metals Charts: Speculator Bets led by Silver, Gold & Platinum Mar 7, 2026
- COT Bonds Charts: Speculator Bets led by 10-Year Bonds & Fed Funds Mar 7, 2026
- COT Energy Charts: Speculator Bets led by Brent Oil & Heating Oil Mar 7, 2026
- COT Soft Commodities Charts: Speculator Bets led by Corn & Soybean Meal Mar 7, 2026
- Investors run to safe-haven assets amid Middle East escalation Mar 6, 2026
- EUR/USD Under Pressure: Middle East Risks Outweigh All Else Mar 6, 2026
- Bitcoin shows resilience to Middle East events. Oil market stabilizes Mar 5, 2026
- GBP/USD: Market Not Expecting BoE Rate Cut in March Mar 5, 2026
- Brent headed for $100? Mar 4, 2026
- Global stock indices continue sell-off due to Middle East conflict Mar 4, 2026