
By Orbex

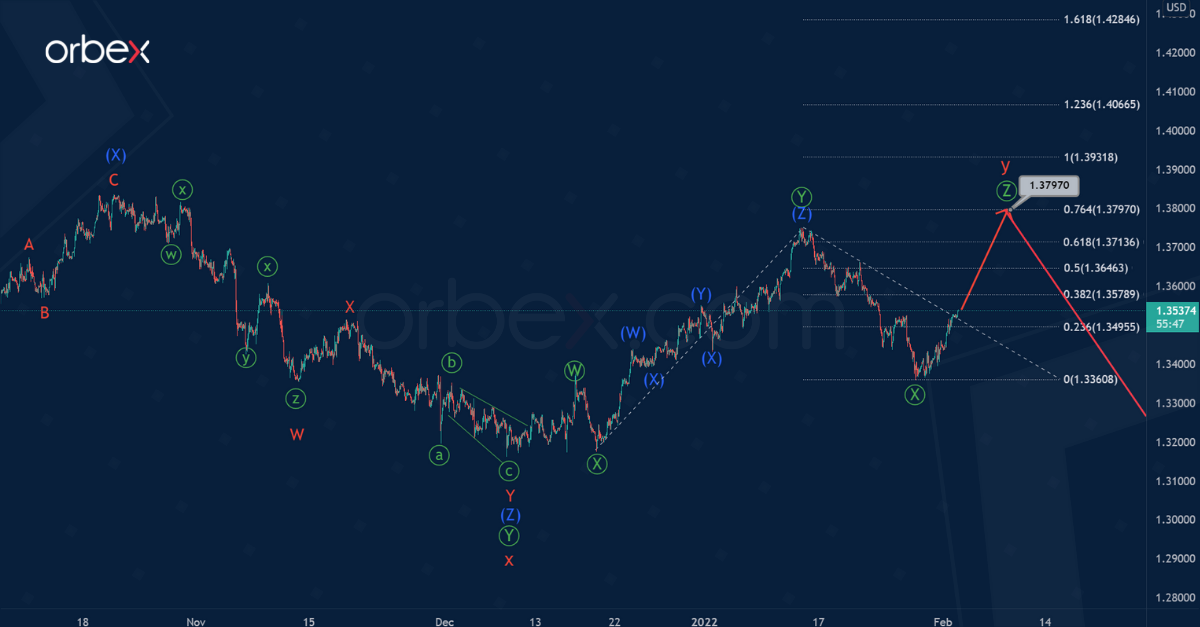
The formation of the GBPUSD currency pair suggests the development of a large intervening wave x of the cycle degree. This most likely takes the form of a triple zigzag Ⓦ-Ⓧ-Ⓨ-Ⓧ-Ⓩ of the primary degree.
Probably, the first four parts of this construction, that is, the primary sub-waves Ⓦ-Ⓧ-Ⓨ-Ⓧ, are already fully complete. It is likely that the growth in the second intervening wave Ⓧ has come to an end. In fact, it looks like a double zigzag (W)-(X)-(Y) of the intermediate degree.
The end of the market decline in the final primary wave Ⓩ could reach the level of 1.312. At that level, wave Ⓩ will be at 76.4% of primary wave Ⓨ.
Free Reports:
 Get our Weekly Commitment of Traders Reports - See where the biggest traders (Hedge Funds and Commercial Hedgers) are positioned in the futures markets on a weekly basis.
 Download Our Metatrader 4 Indicators – Put Our Free MetaTrader 4 Custom Indicators on your charts when you join our Weekly Newsletter
According to an alternative scenario, the primary double zigzag Ⓦ-Ⓧ-Ⓨ came to an end. And with it a large intervening wave x of the cycle degree ended.
Thus, the ascending section (which was formed after the cycle wave x), could indicate the beginning of the development of the cycle actionary wave y.
In the upcoming trading weeks, an increase in the primary wave Ⓩ near 1.379 is likely. At the specified price point, wave Ⓩ will be at 76.4% of wave Ⓨ.
![]() Article by Orbex
Article by Orbex
Orbex is a fully licensed broker that was established in 2011. Founded with a mission to serve its traders responsibly and provides traders with access to the world’s largest and most liquid financial markets. www.orbex.com

- COT Metals Charts: Speculator Bets led by Silver, Gold & Platinum Mar 7, 2026
- COT Bonds Charts: Speculator Bets led by 10-Year Bonds & Fed Funds Mar 7, 2026
- COT Energy Charts: Speculator Bets led by Brent Oil & Heating Oil Mar 7, 2026
- COT Soft Commodities Charts: Speculator Bets led by Corn & Soybean Meal Mar 7, 2026
- Investors run to safe-haven assets amid Middle East escalation Mar 6, 2026
- EUR/USD Under Pressure: Middle East Risks Outweigh All Else Mar 6, 2026
- Bitcoin shows resilience to Middle East events. Oil market stabilizes Mar 5, 2026
- GBP/USD: Market Not Expecting BoE Rate Cut in March Mar 5, 2026
- Brent headed for $100? Mar 4, 2026
- Global stock indices continue sell-off due to Middle East conflict Mar 4, 2026