
Article By RoboForex.com
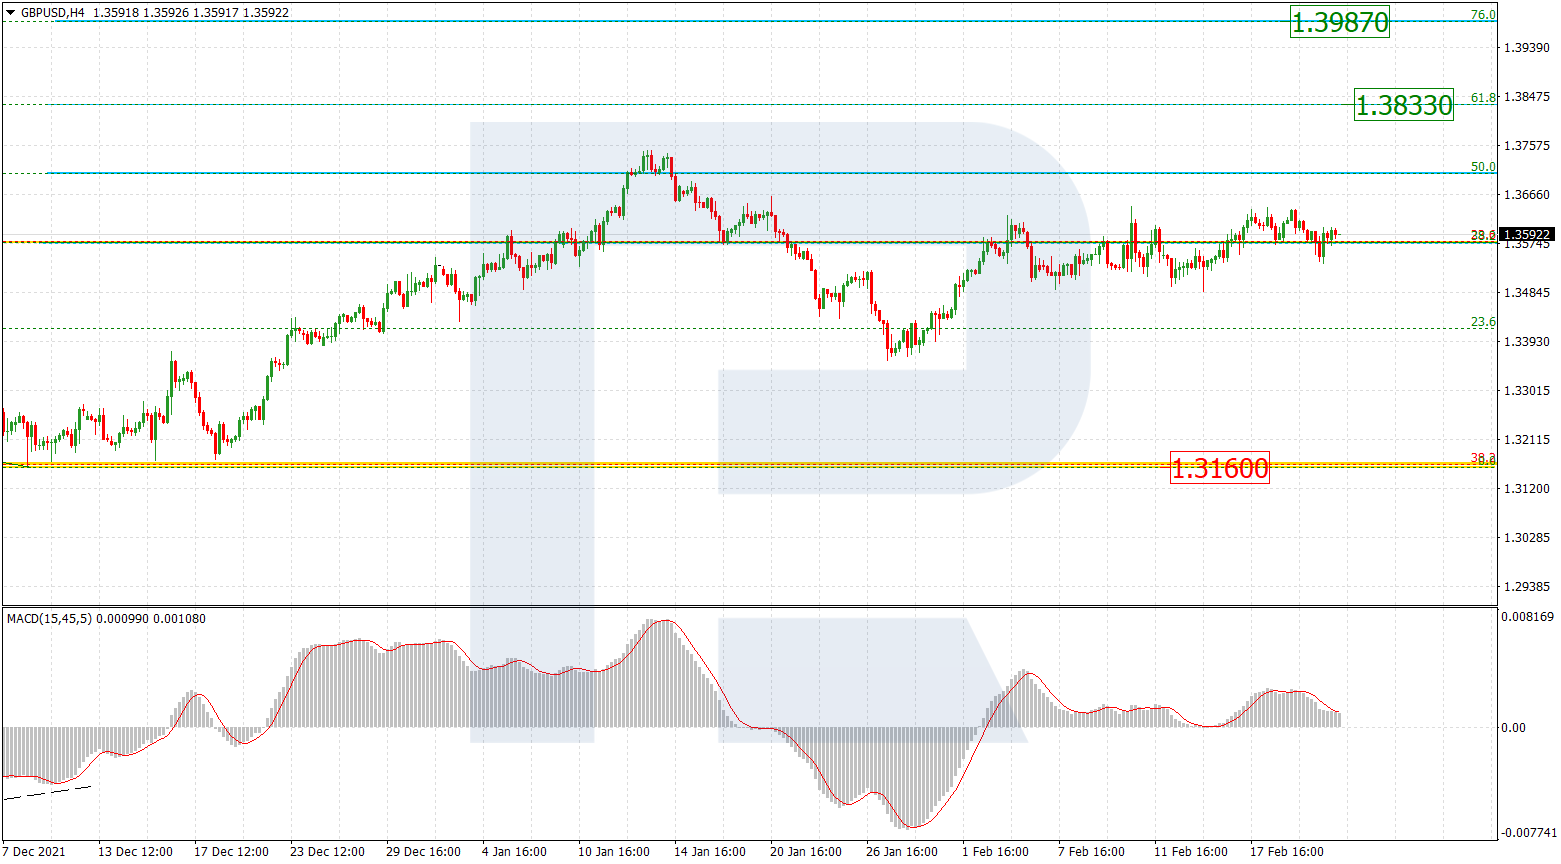
GBPUSD, “Great Britain Pound vs US Dollar”
As we can see in the H4 chart, GBPUSD is still consolidating around 38.2% fibo and this consolidation range may later be followed by a new rising impulse. The mid-term upside targets may be 61.8% and 76.0% fibo at 1.3833 and 1.3987 respectively. The key support remains at the low at 1.3160.

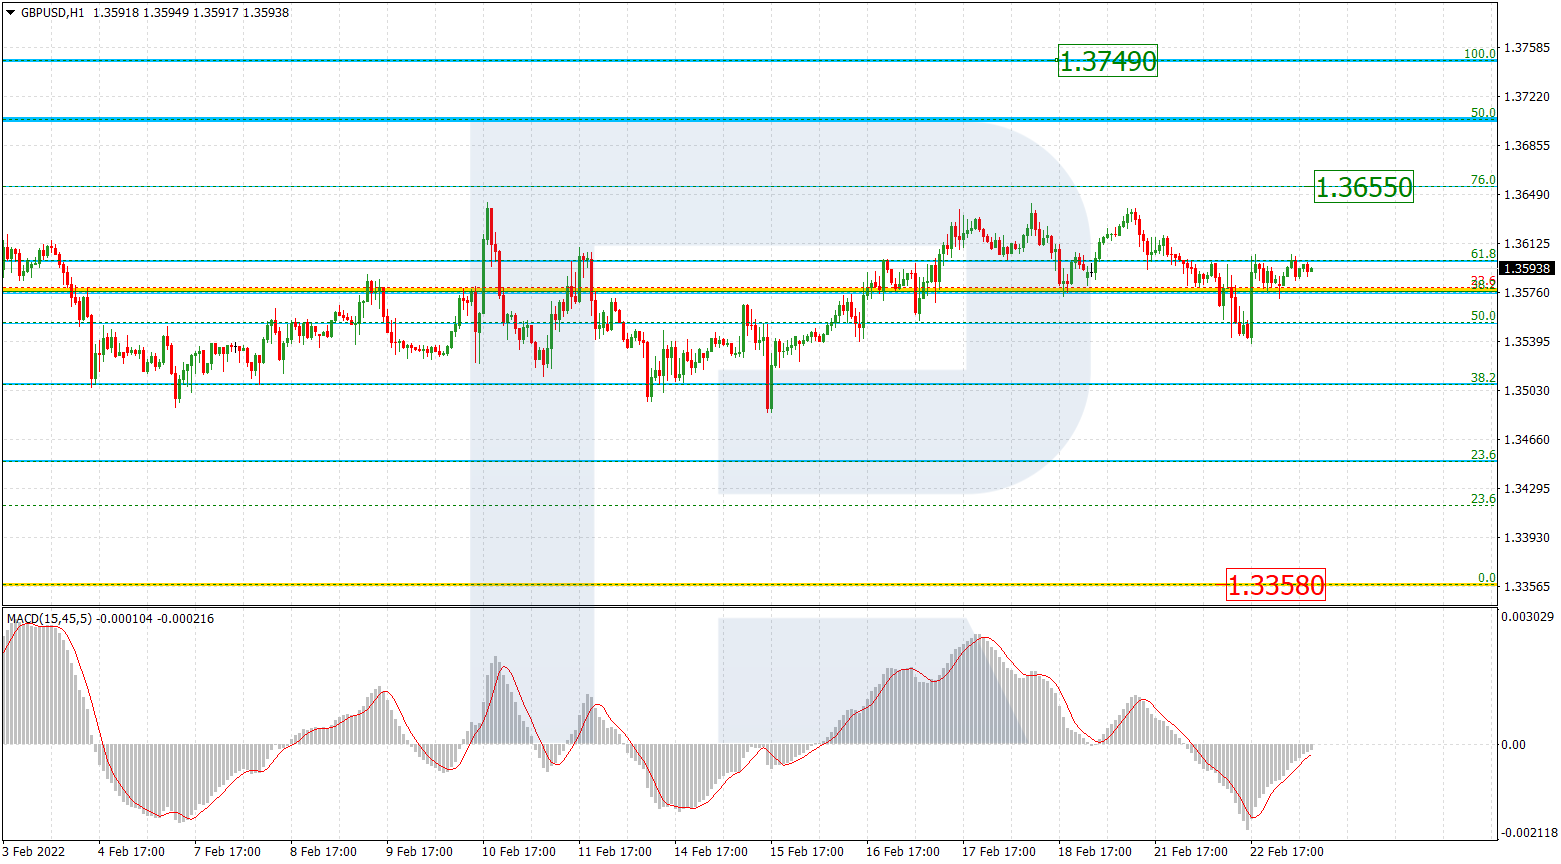
The H1 chart shows that the pair has tested 61.8% fibo several times; right now, the asset is testing it again. In this case, the price is expected to continue trading upwards. The upside targets are 76.0% fibo and the high at 1.3655 and 1.3749 respectively. The local support is at 1.3358.
Free Reports:
 Download Our Metatrader 4 Indicators – Put Our Free MetaTrader 4 Custom Indicators on your charts when you join our Weekly Newsletter
 Get our Weekly Commitment of Traders Reports - See where the biggest traders (Hedge Funds and Commercial Hedgers) are positioned in the futures markets on a weekly basis.
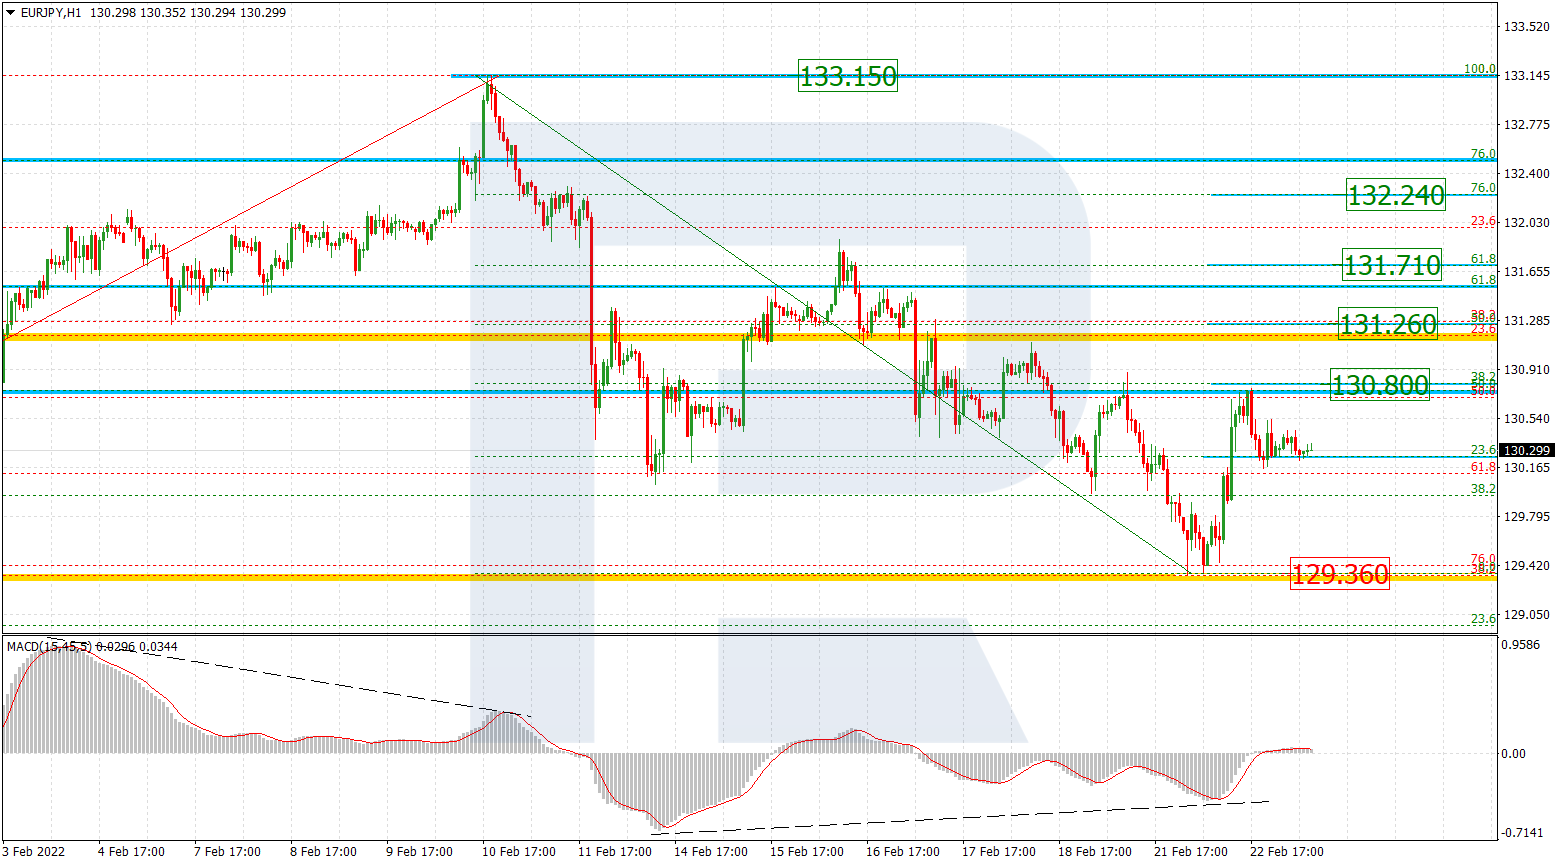
EURJPY, “Euro vs. Japanese Yen”
As we can see in the H4 chart, EURJPY is completing the descending correction, which may be followed by a new wave to the upside to reach the high at 134.12. The support is the low at 127.38.

The H1 chart shows a more detailed structure of the current price movement. Divergence on MACD made the asset stop falling at 76.0% fibo and start a new growth, which has already reached 38.2% fibo at 130.80. After a slight pullback, the pair may resume growing to reach 50.0%, 61.8%, and 76.0% fibo at 131.26, 131.71, and 132.24 respectively, and then the high at 133.15. The local support is the low at 129.36.
Article By RoboForex.com
Attention!
Forecasts presented in this section only reflect the author’s private opinion and should not be considered as guidance for trading. RoboForex LP bears no responsibility for trading results based on trading recommendations described in these analytical reviews.

- Prices push oil above $100 per barrel Mar 9, 2026
- COT Metals Charts: Speculator Bets led by Silver, Gold & Platinum Mar 7, 2026
- COT Bonds Charts: Speculator Bets led by 10-Year Bonds & Fed Funds Mar 7, 2026
- COT Energy Charts: Speculator Bets led by Brent Oil & Heating Oil Mar 7, 2026
- COT Soft Commodities Charts: Speculator Bets led by Corn & Soybean Meal Mar 7, 2026
- Investors run to safe-haven assets amid Middle East escalation Mar 6, 2026
- EUR/USD Under Pressure: Middle East Risks Outweigh All Else Mar 6, 2026
- Bitcoin shows resilience to Middle East events. Oil market stabilizes Mar 5, 2026
- GBP/USD: Market Not Expecting BoE Rate Cut in March Mar 5, 2026
- Brent headed for $100? Mar 4, 2026