
Article By RoboForex.com
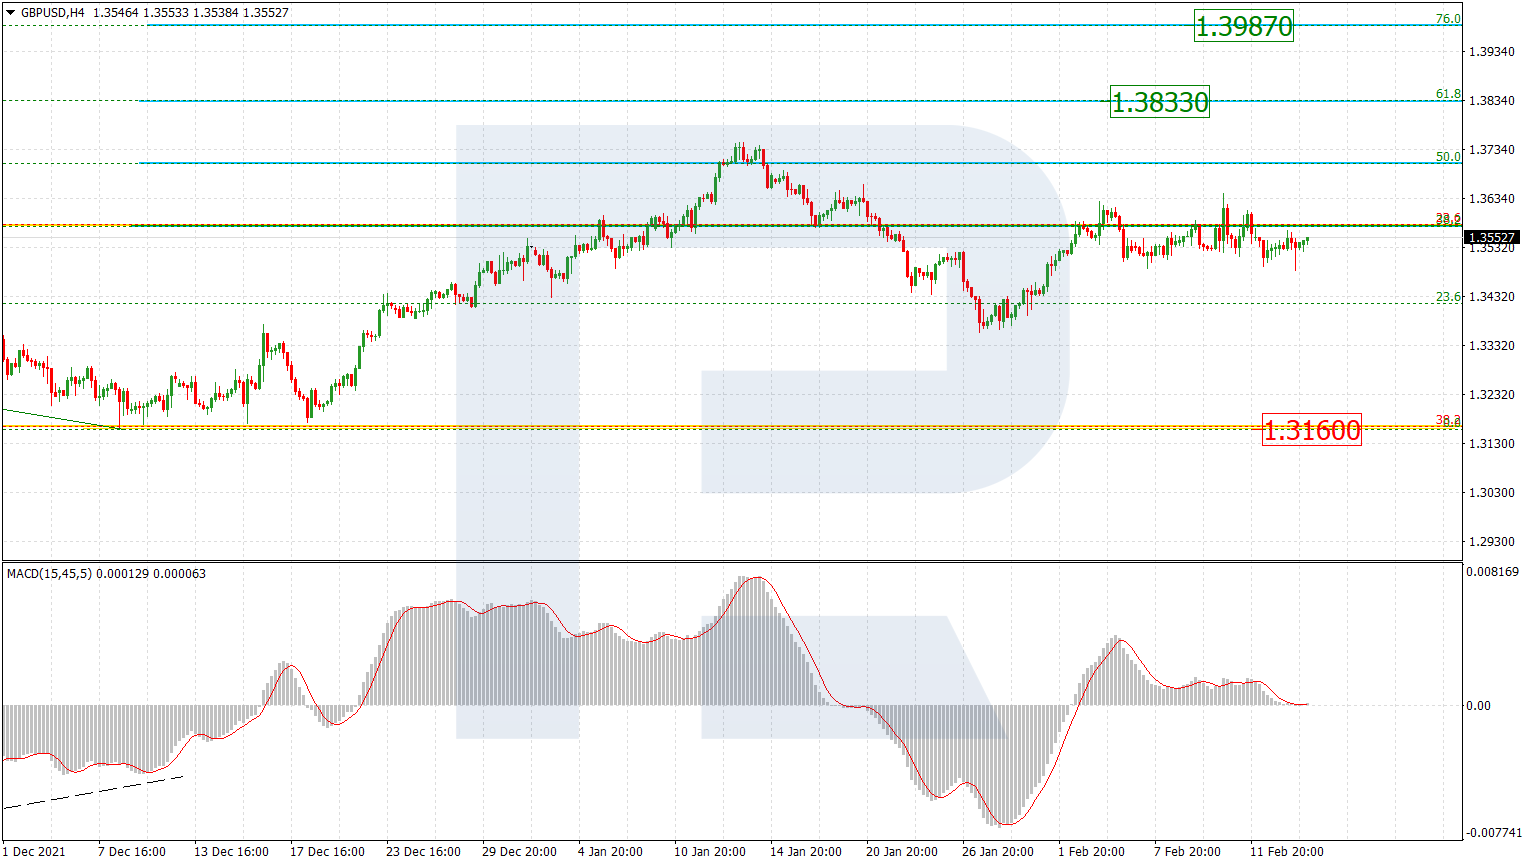
GBPUSD, “Great Britain Pound vs US Dollar”
As we can see in the H4 chart, GBPUSD is consolidating around 38.2% fibo. This consolidation range may be followed by a new rising impulse. The mid-term upside targets may be 61.8% and 76.0% fibo at 1.3833 and 1.3987 respectively. The key support remains at the low at 1.3160.

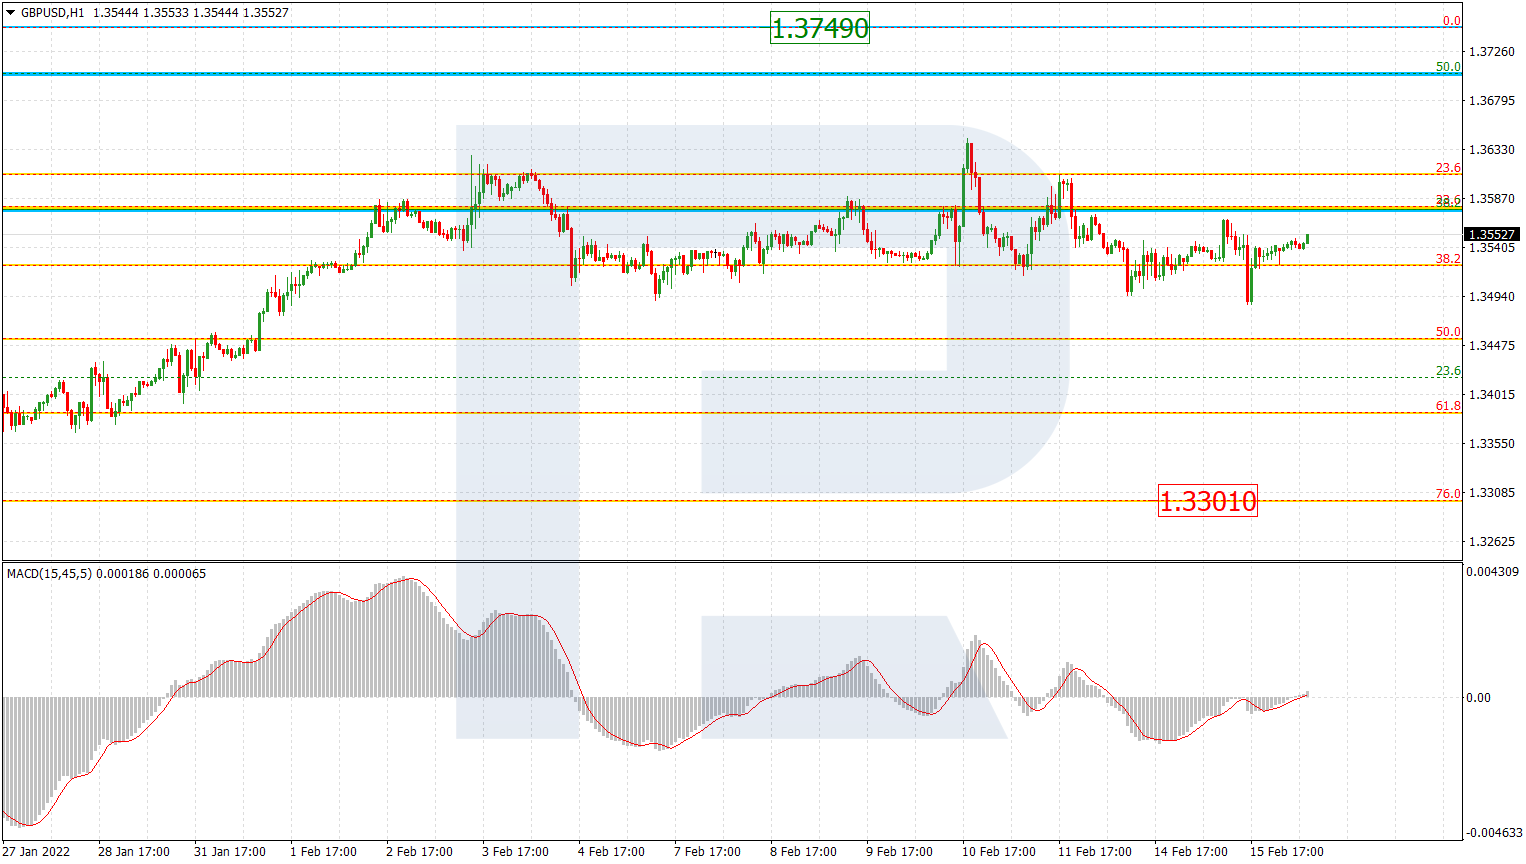
The H1 chart shows that after falling and reaching 61.8% fibo, the pair started a new wave to the upside and has already reached 23.6% fibo. Possibly, in the future, the price may continue growing and reach the local high at 1.3749 or even break it. Another scenario implies a new wave to the downside to return to 76.0% fibo at 1.3301 but it’s highly unlikely.
Free Reports:
 Get our Weekly Commitment of Traders Reports - See where the biggest traders (Hedge Funds and Commercial Hedgers) are positioned in the futures markets on a weekly basis.
 Sign Up for Our Stock Market Newsletter – Get updated on News, Charts & Rankings of Public Companies when you join our Stocks Newsletter
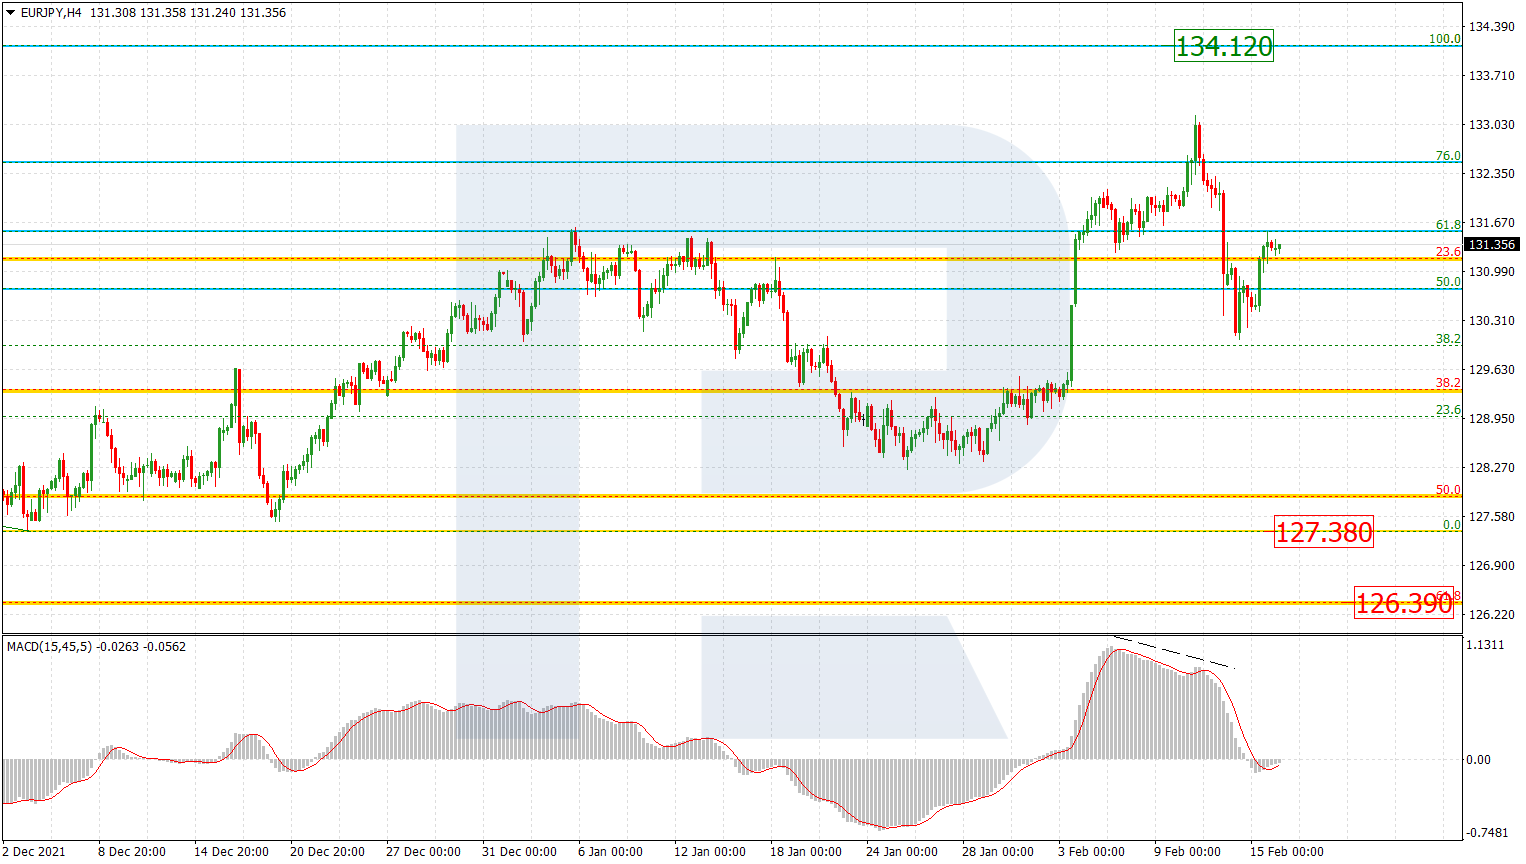
EURJPY, “Euro vs. Japanese Yen”
As we can see in the H4 chart, divergence on MACD made EURJPY complete its rising wave at 76.0% fibo and start a new correctional decline, which may be over quite soon. In the nearest future, the asset may resume trading upwards to reach the high at 134.12. The support is the low at 127.38.
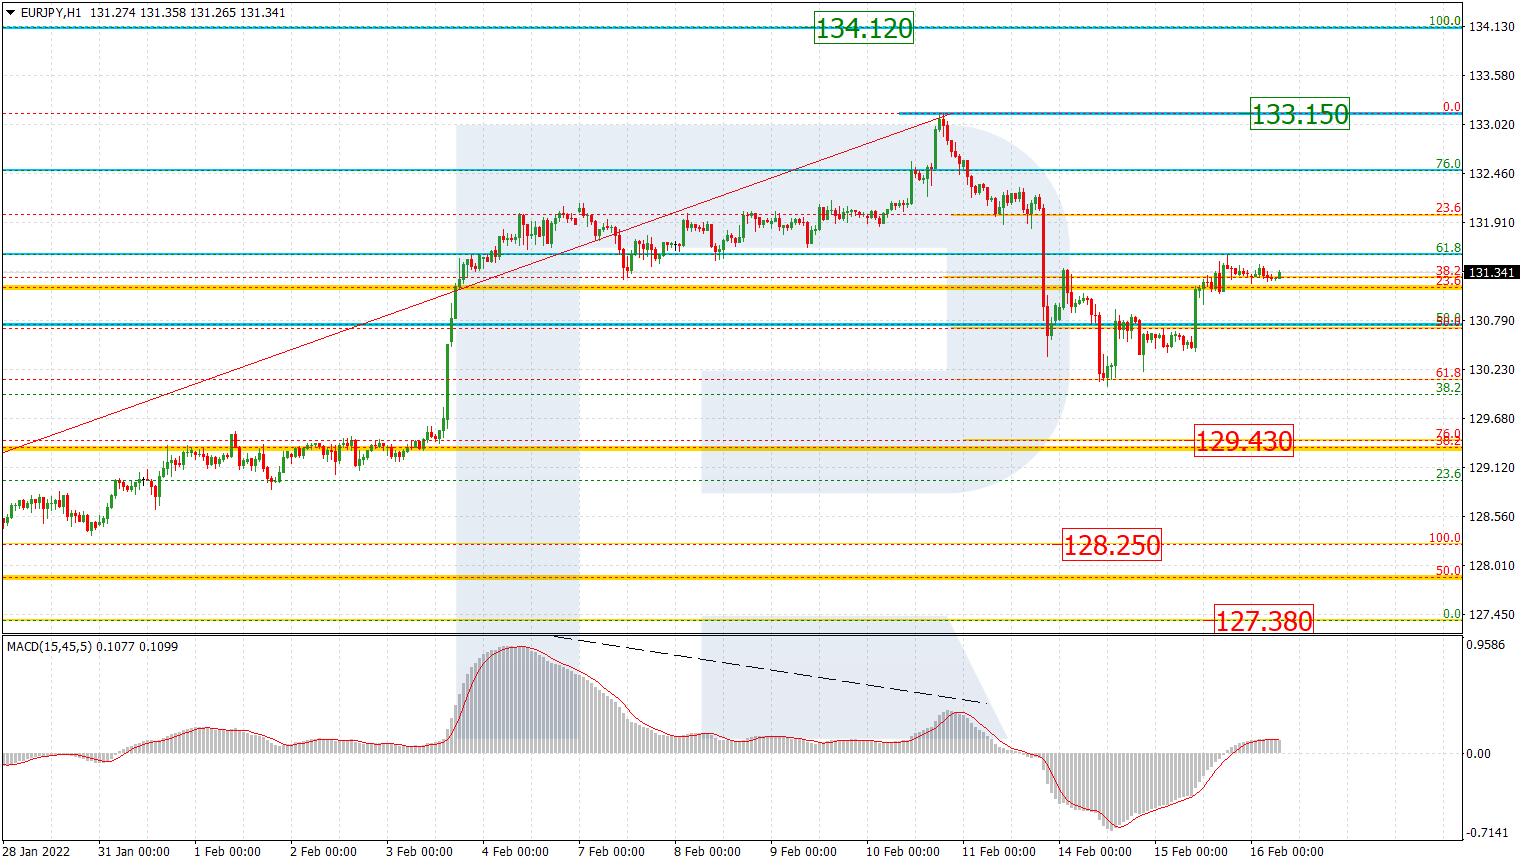
In the H1 chart, divergence on MACD made the asset correct to the downside and reach 61.8% fibo. By now, the price has returned to 38.2% fibo; at the moment, it is heading towards the local high at 133.15. Later, the instrument may form one more descending impulse to reach 76.0% at 129.43.
Article By RoboForex.com
Attention!
Forecasts presented in this section only reflect the author’s private opinion and should not be considered as guidance for trading. RoboForex LP bears no responsibility for trading results based on trading recommendations described in these analytical reviews.

- Trump signals de-escalation in the Middle East; China’s trade surplus hits a new record Mar 10, 2026
- EUR/USD in Turbulence: Market Questions When Conflict Over Iran Will End Mar 10, 2026
- Prices push oil above $100 per barrel Mar 9, 2026
- COT Metals Charts: Speculator Bets led by Silver, Gold & Platinum Mar 7, 2026
- COT Bonds Charts: Speculator Bets led by 10-Year Bonds & Fed Funds Mar 7, 2026
- COT Energy Charts: Speculator Bets led by Brent Oil & Heating Oil Mar 7, 2026
- COT Soft Commodities Charts: Speculator Bets led by Corn & Soybean Meal Mar 7, 2026
- Investors run to safe-haven assets amid Middle East escalation Mar 6, 2026
- EUR/USD Under Pressure: Middle East Risks Outweigh All Else Mar 6, 2026
- Bitcoin shows resilience to Middle East events. Oil market stabilizes Mar 5, 2026