
Article By RoboForex.com
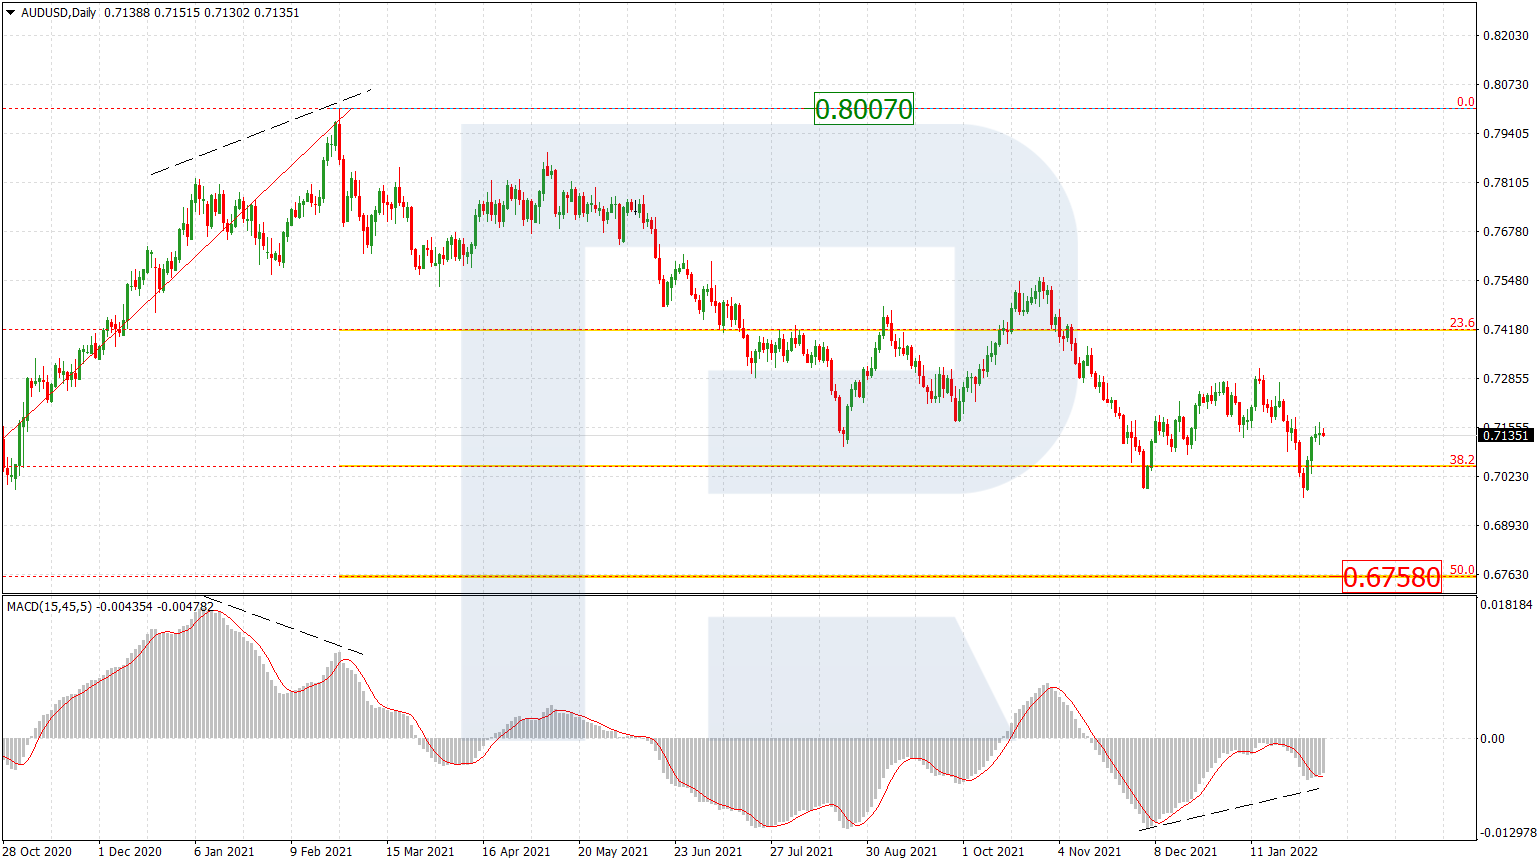
AUDUSD, “Australian Dollar vs US Dollar”
The daily chart shows a double test of the long-term 38.2% fibo and an update of the low, as well as convergence on MACD. In this case, the pair is expected to start a new rising correction, which may later be followed by a further downtrend towards 50.0% and 61.8% fibo at 0.6758 and 0.6464 respectively. The resistance is the high at 0.8007.

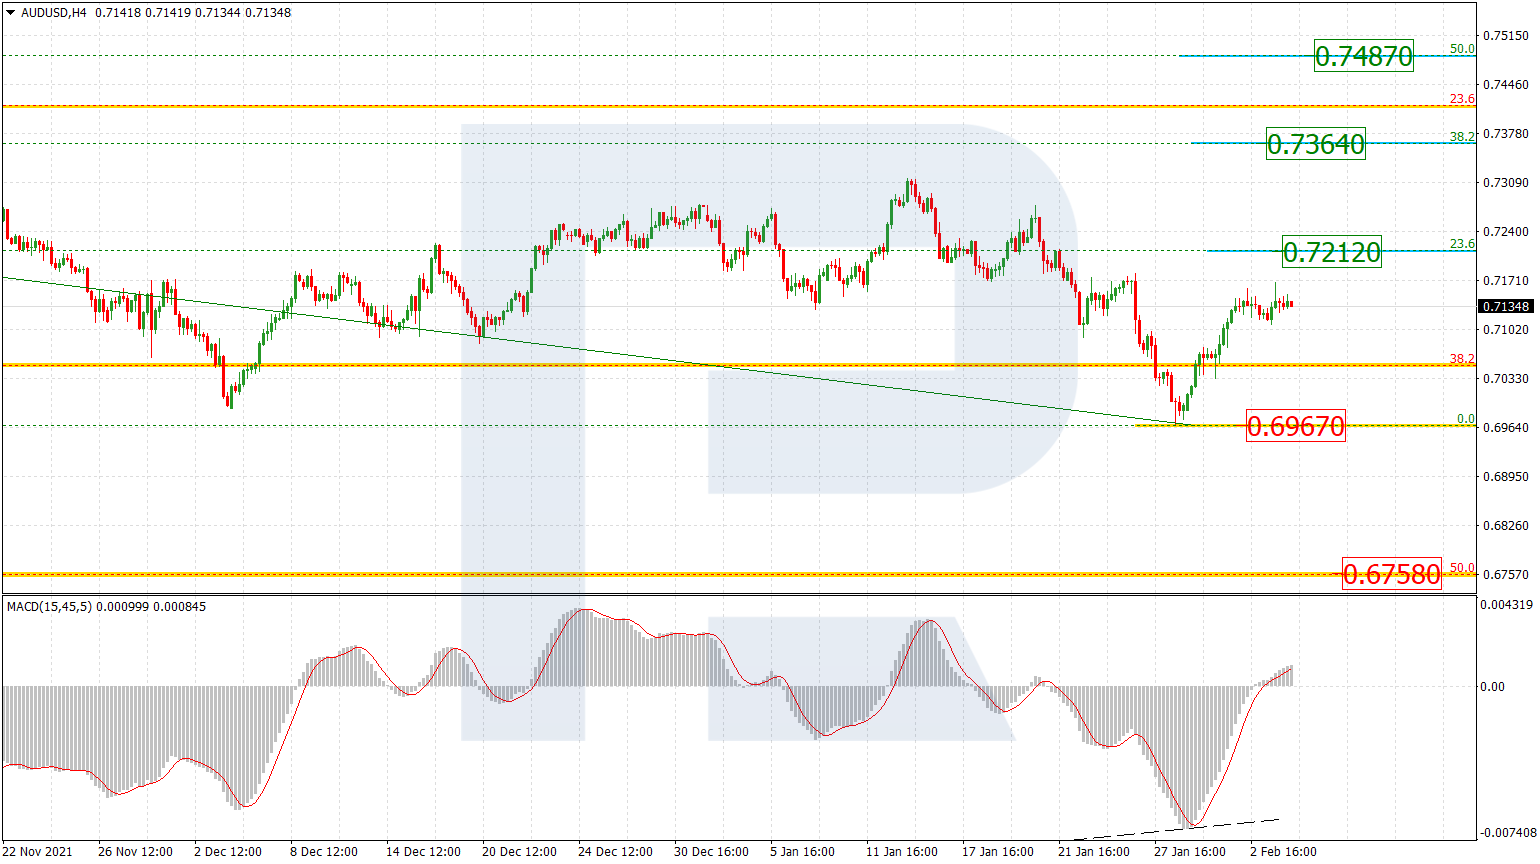
In the H4 chart, the asset is forming the first correctional wave, which is approaching to test 23.6% fibo at 0.7212 and may later continue up to 38.2% and 50.0% fibo at 0.7364 and 0.7487 respectively. If the price breaks the local support at 0.6967, it may continue the mid-term descending tendency.
Free Reports:
 Download Our Metatrader 4 Indicators – Put Our Free MetaTrader 4 Custom Indicators on your charts when you join our Weekly Newsletter
 Get our Weekly Commitment of Traders Reports - See where the biggest traders (Hedge Funds and Commercial Hedgers) are positioned in the futures markets on a weekly basis.
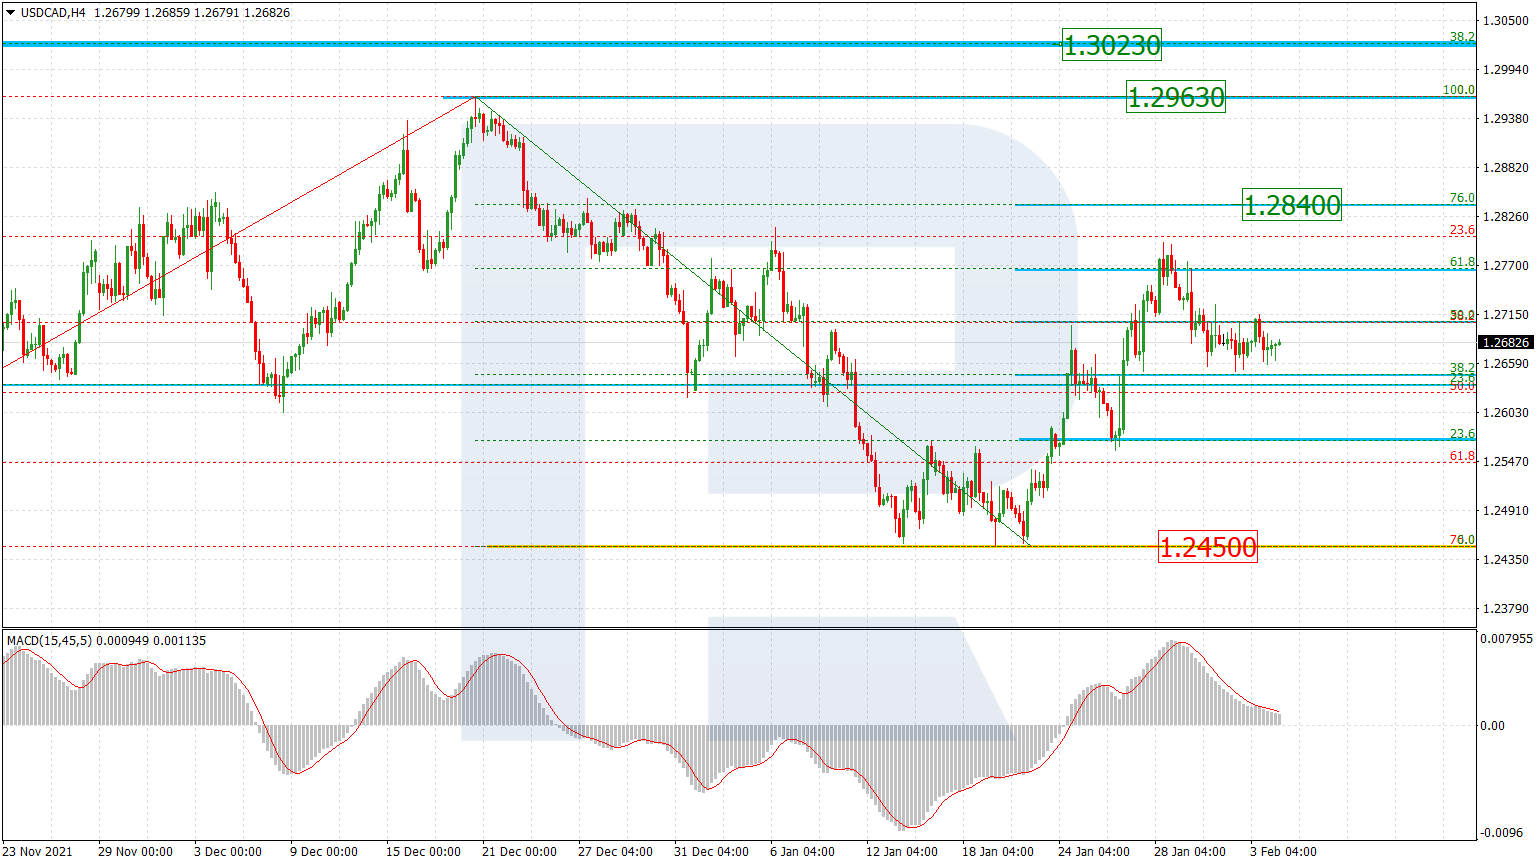
USDCAD, “US Dollar vs Canadian Dollar”
As we can see in the H4 chart, the asset is correcting within the rising wave, which earlier tested 61.8% fibo. After the pullback is over, the pair may resume growing towards 76.0% fibo and the high at 1.2840 and 1.2963 respectively. A breakout of the high will result in a further uptrend towards the long-term 38.2% fibo at 1.3023. The support is the low at 1.2450.
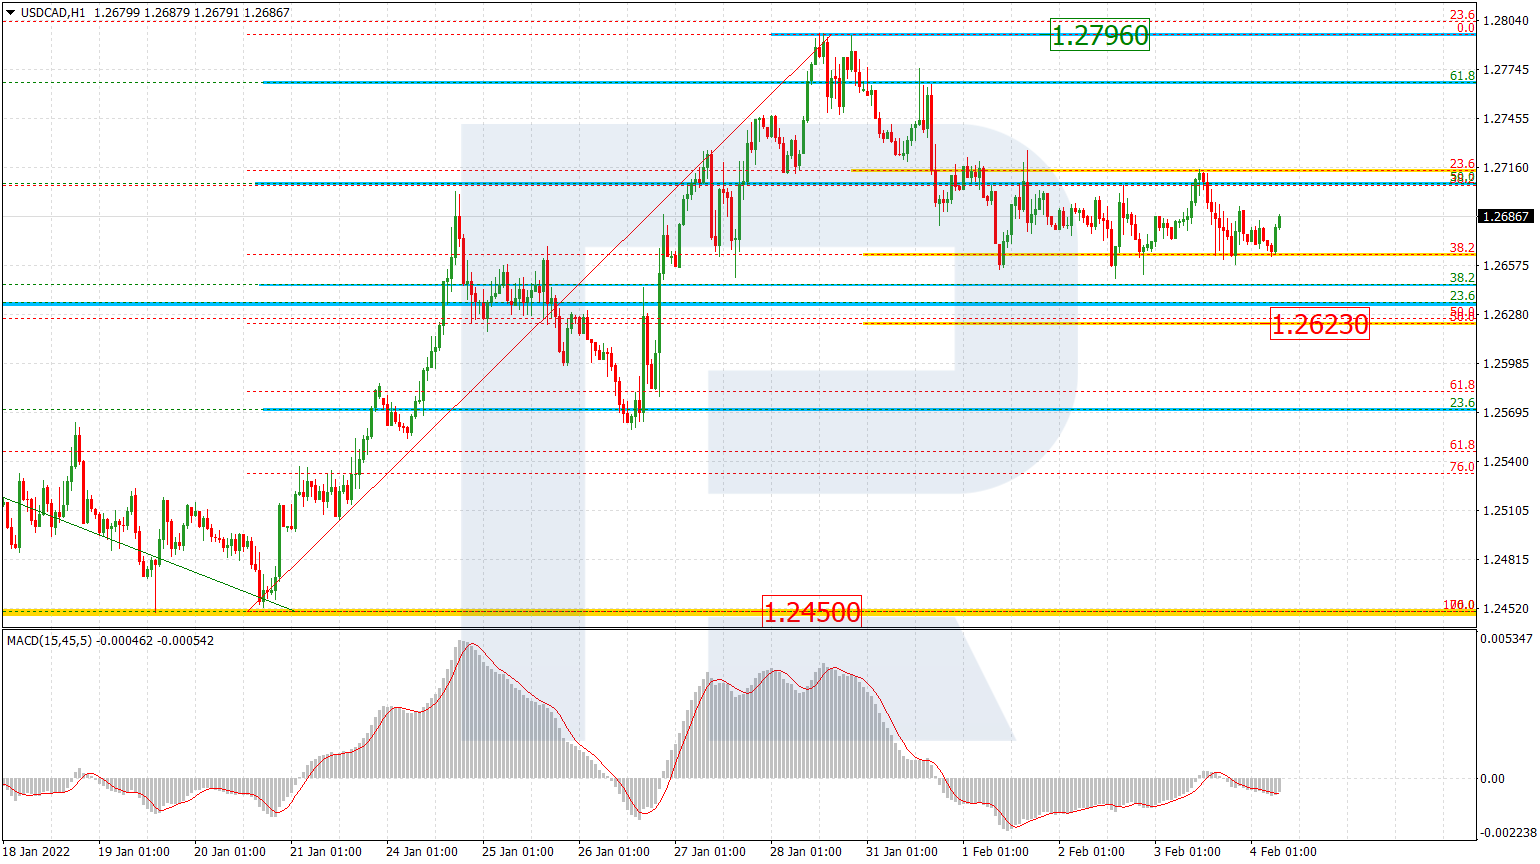
The H1 chart shows a more detailed structure of the current short-term correction. After testing 38.2% fibo several times, the descending wave has failed to break it. Possibly, the price may yet fall and complete the pullback at 50.0% fibo. Later, the asset may resume trading upwards to reach the local high at 1.2796.
Article By RoboForex.com
Attention!
Forecasts presented in this section only reflect the author’s private opinion and should not be considered as guidance for trading. RoboForex LP bears no responsibility for trading results based on trading recommendations described in these analytical reviews.

- COT Metals Charts: Speculator Bets led by Silver, Gold & Platinum Mar 7, 2026
- COT Bonds Charts: Speculator Bets led by 10-Year Bonds & Fed Funds Mar 7, 2026
- COT Energy Charts: Speculator Bets led by Brent Oil & Heating Oil Mar 7, 2026
- COT Soft Commodities Charts: Speculator Bets led by Corn & Soybean Meal Mar 7, 2026
- Investors run to safe-haven assets amid Middle East escalation Mar 6, 2026
- EUR/USD Under Pressure: Middle East Risks Outweigh All Else Mar 6, 2026
- Bitcoin shows resilience to Middle East events. Oil market stabilizes Mar 5, 2026
- GBP/USD: Market Not Expecting BoE Rate Cut in March Mar 5, 2026
- Brent headed for $100? Mar 4, 2026
- Global stock indices continue sell-off due to Middle East conflict Mar 4, 2026