
Article By RoboForex.com
Brent
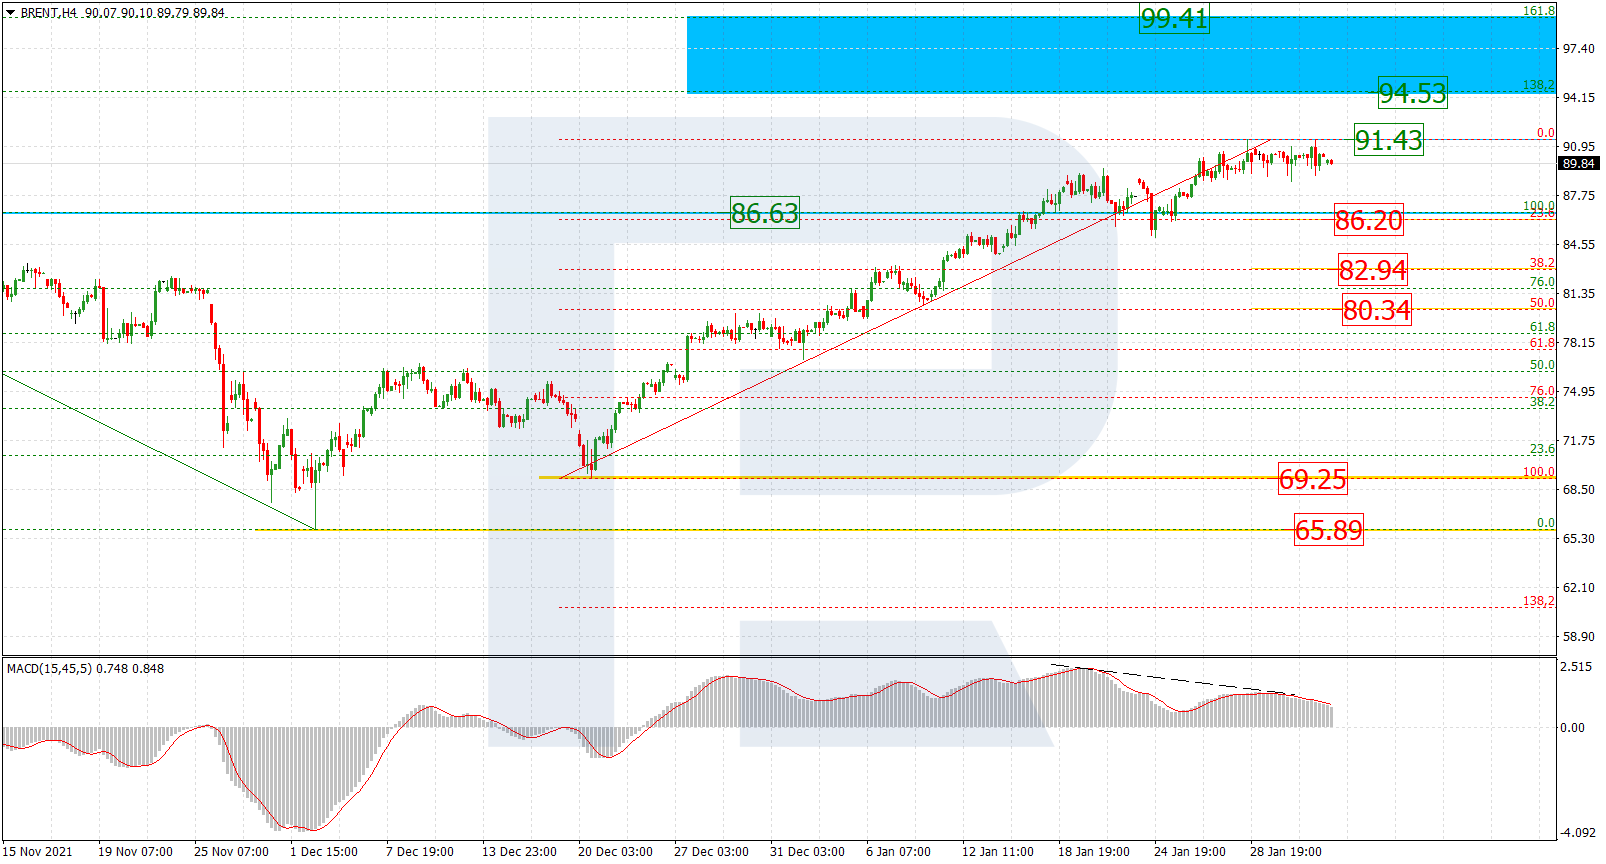
As we can see in the H4 chart, after breaking the high at 86.63 and fixing above it, Brent has stopped at 91.43. At first, the asset intended to reach the post-correctional extension area between 138.2% and 161.8% fibo at 94.53 and 99.41 respectively, but the above-mentioned level turned into strong resistance. Both this resistance and divergence on MACD are a signal in favour of a new pullback towards the local support at 69.26, a breakout of which will lead to the key one at 65.89.

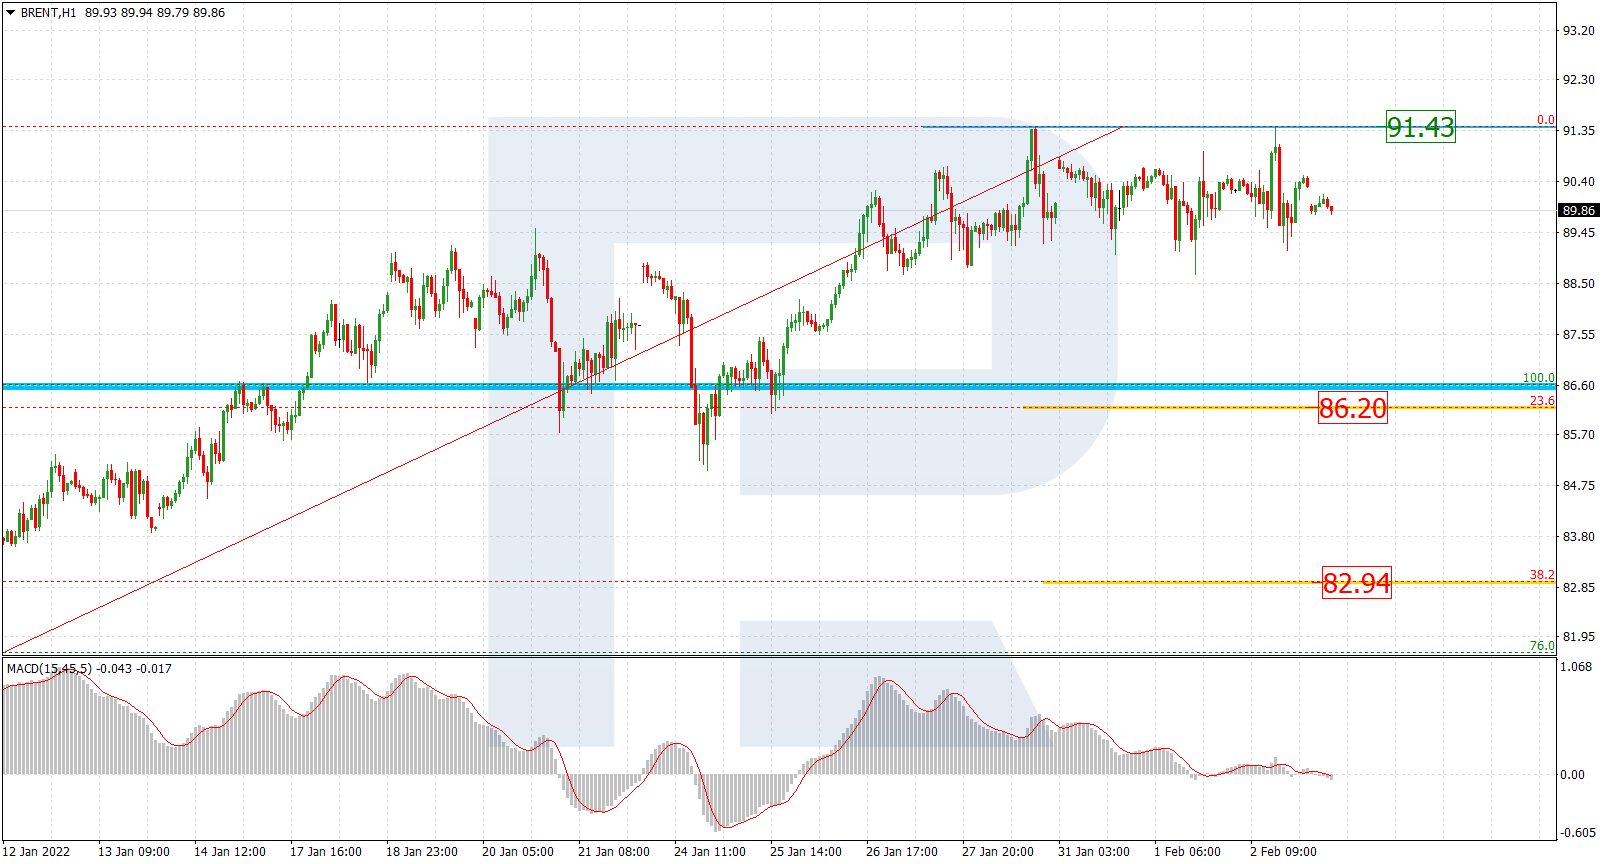
The H1 chart shows the downside correctional targets – 23.6%, 38.2%, and 50.0% fibo at 86.20, 82.94, and 80.34 respectively. A breakout of the resistance will result on a further uptrend.
Free Reports:
 Sign Up for Our Stock Market Newsletter – Get updated on News, Charts & Rankings of Public Companies when you join our Stocks Newsletter
 Get our Weekly Commitment of Traders Reports - See where the biggest traders (Hedge Funds and Commercial Hedgers) are positioned in the futures markets on a weekly basis.
Dow Jones
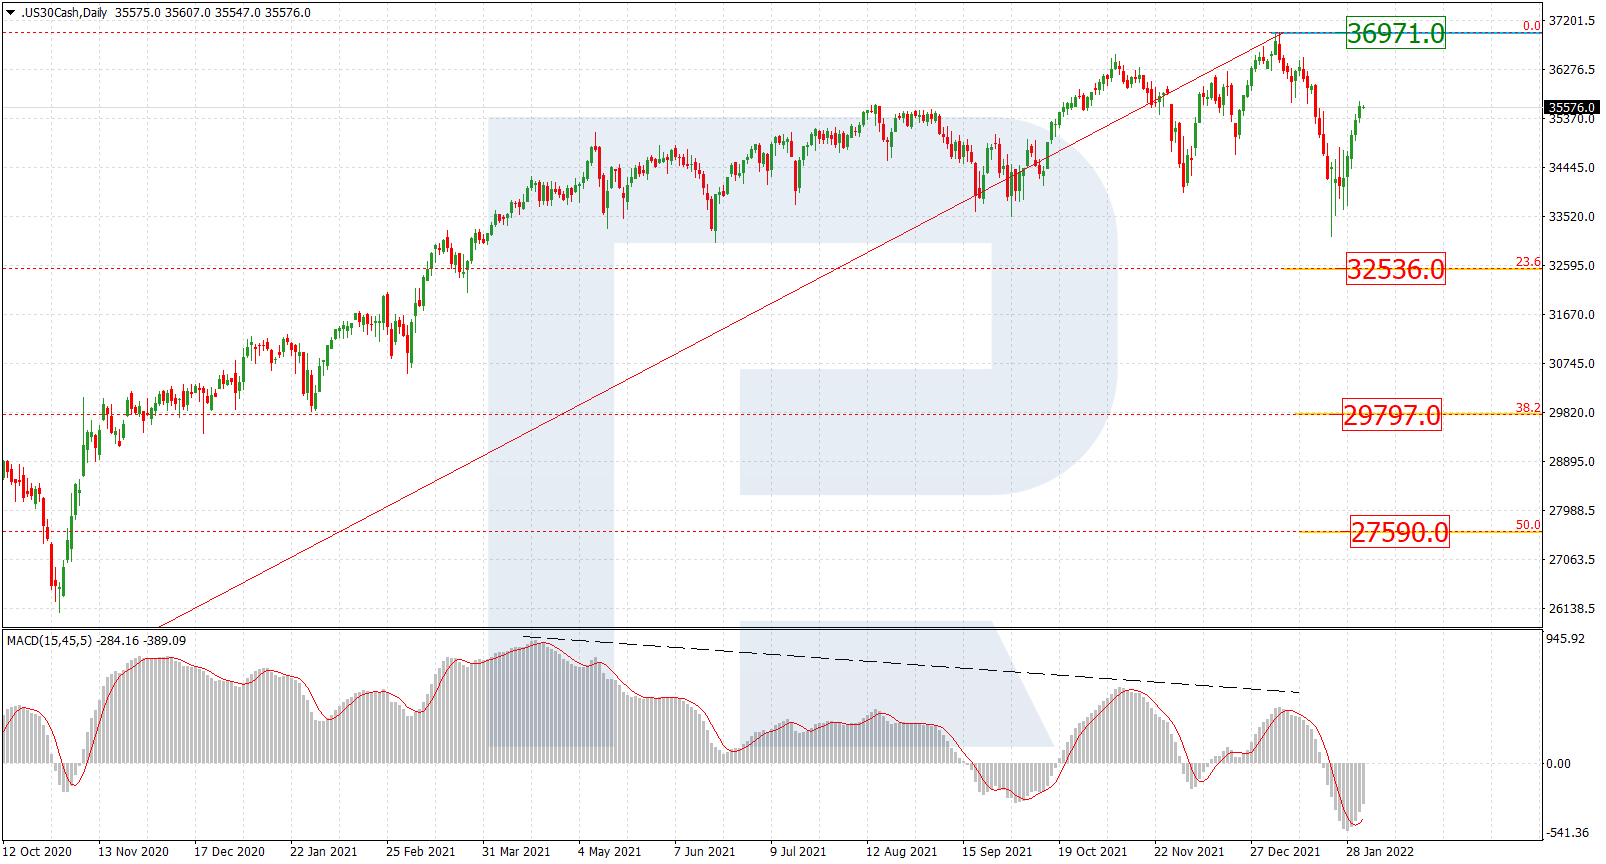
As we can see in the daily chart, after completing the first bearish wave, the asset is correcting upwards. As long as the price is trading below the high at 36971.0, the long-term downtrend may continue. The key downside targets are 23.6%, 38.2%, and 50.0% fibo at 32536.0, 29797.0, and 27590.0 respectively.
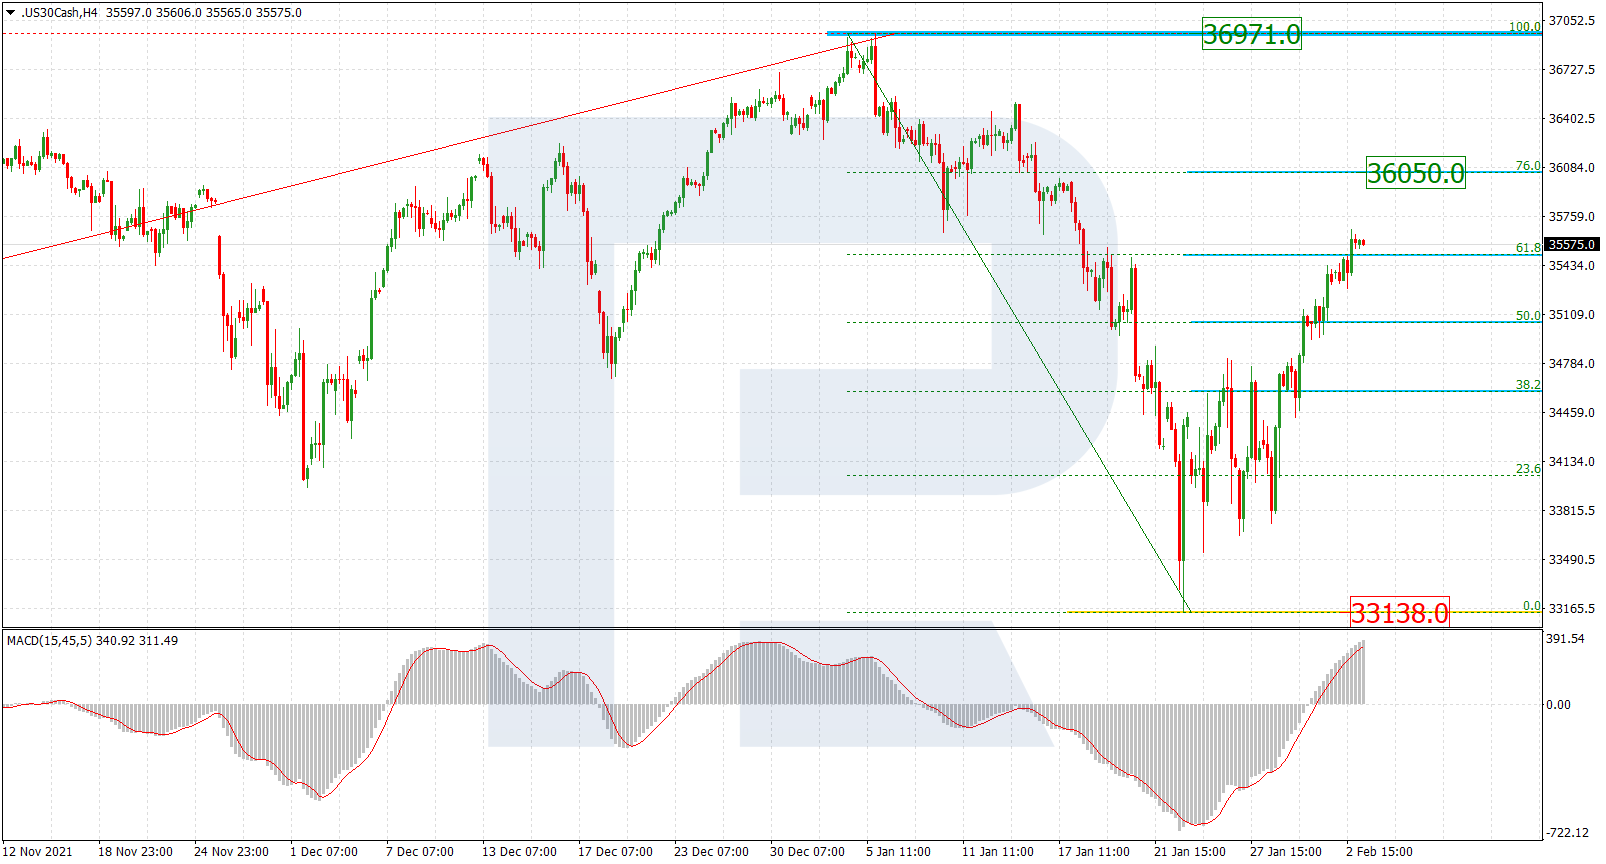
The H4 chart shows that the correctional uptrend has broken 61.8% fibo; right now, it is heading towards 76.0% fibo at 36050.0. After testing the target level, the index may reverse and fall to reach the support at 33138.0.
Article By RoboForex.com
Attention!
Forecasts presented in this section only reflect the author’s private opinion and should not be considered as guidance for trading. RoboForex LP bears no responsibility for trading results based on trading recommendations described in these analytical reviews.

- Prices push oil above $100 per barrel Mar 9, 2026
- COT Metals Charts: Speculator Bets led by Silver, Gold & Platinum Mar 7, 2026
- COT Bonds Charts: Speculator Bets led by 10-Year Bonds & Fed Funds Mar 7, 2026
- COT Energy Charts: Speculator Bets led by Brent Oil & Heating Oil Mar 7, 2026
- COT Soft Commodities Charts: Speculator Bets led by Corn & Soybean Meal Mar 7, 2026
- Investors run to safe-haven assets amid Middle East escalation Mar 6, 2026
- EUR/USD Under Pressure: Middle East Risks Outweigh All Else Mar 6, 2026
- Bitcoin shows resilience to Middle East events. Oil market stabilizes Mar 5, 2026
- GBP/USD: Market Not Expecting BoE Rate Cut in March Mar 5, 2026
- Brent headed for $100? Mar 4, 2026