
By Orbex
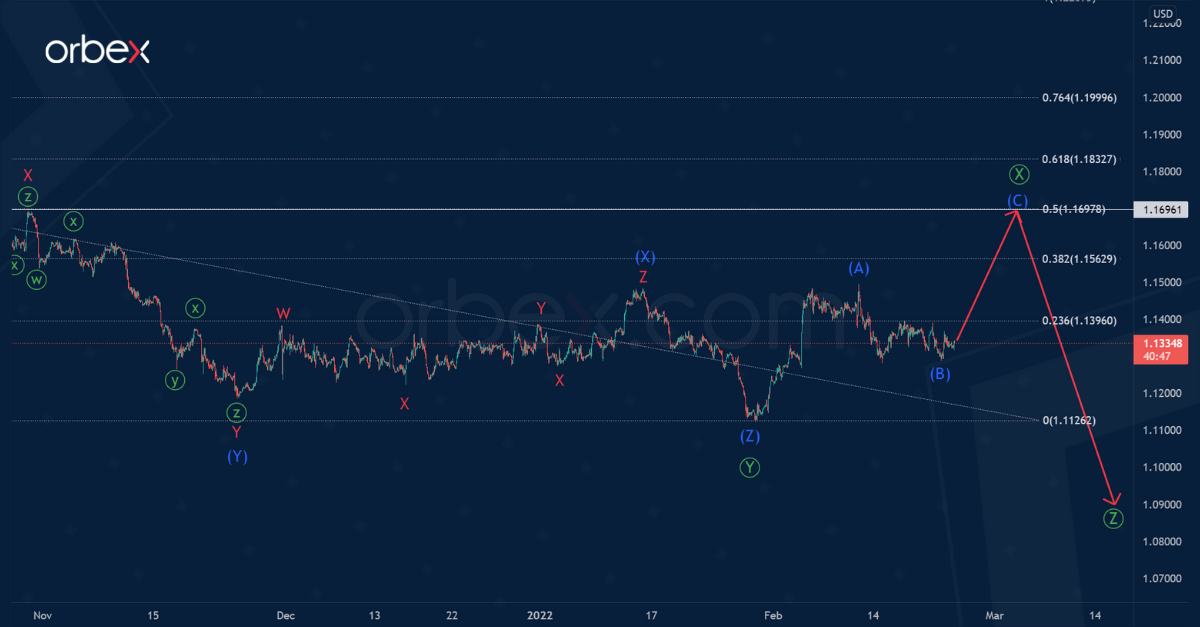
The internal structure of the EURUSD pair suggests the construction of a downward correction pattern. This takes the form of a triple zigzag of the primary degree with sub-waves Ⓦ-Ⓧ-Ⓨ-Ⓧ-Ⓩ.
It seems that the bearish primary wave Ⓨ has ended, which took the form of a triple zigzag (W)-(X)-(Y)-(X)-(Z) of the intermediate degree. Prices then moved upwards within the primary intervening wave Ⓧ, taking the form of a simple zigzag (A)-(B)-(C).
Moreover, at the specified level, the primary wave Ⓧ will be at 50% of wave Ⓨ.
Free Reports:
 Get our Weekly Commitment of Traders Reports - See where the biggest traders (Hedge Funds and Commercial Hedgers) are positioned in the futures markets on a weekly basis.
 Sign Up for Our Stock Market Newsletter – Get updated on News, Charts & Rankings of Public Companies when you join our Stocks Newsletter
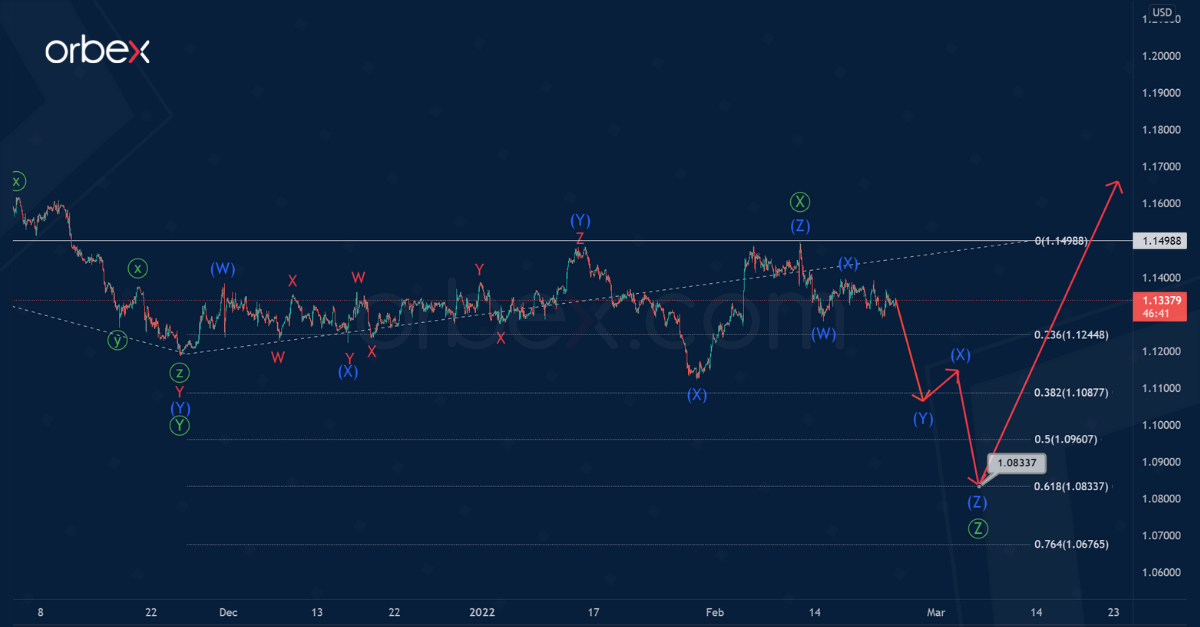
Let’s consider another option in which the intervening wave Ⓧ could already be fully complete. According to this view, it is a triple three (W)-(X)-(Y)-(X)-(Z).
In this case, we can expect the formation of a descending primary wave Ⓩ. This actionary wave is likely to take a complex triple zigzag formation (W)-(X)-(Y)-(X)-(Z). The approximate internal structure of the sub-wave Ⓩ is shown by trend lines.
The end of the correction decline in the primary wave Ⓩ is likely near 1.0833. At that level, primary wave Ⓩ will be at the 61.8% Fibonacci extension of wave Ⓨ.
After the completion of the primary pattern, a new bullish trend will update the maximum of 1.1498.
![]() Article by Orbex
Article by Orbex
Orbex is a fully licensed broker that was established in 2011. Founded with a mission to serve its traders responsibly and provides traders with access to the world’s largest and most liquid financial markets. www.orbex.com

- Trump signals de-escalation in the Middle East; China’s trade surplus hits a new record Mar 10, 2026
- EUR/USD in Turbulence: Market Questions When Conflict Over Iran Will End Mar 10, 2026
- Prices push oil above $100 per barrel Mar 9, 2026
- COT Metals Charts: Speculator Bets led by Silver, Gold & Platinum Mar 7, 2026
- COT Bonds Charts: Speculator Bets led by 10-Year Bonds & Fed Funds Mar 7, 2026
- COT Energy Charts: Speculator Bets led by Brent Oil & Heating Oil Mar 7, 2026
- COT Soft Commodities Charts: Speculator Bets led by Corn & Soybean Meal Mar 7, 2026
- Investors run to safe-haven assets amid Middle East escalation Mar 6, 2026
- EUR/USD Under Pressure: Middle East Risks Outweigh All Else Mar 6, 2026
- Bitcoin shows resilience to Middle East events. Oil market stabilizes Mar 5, 2026