
By Orbex
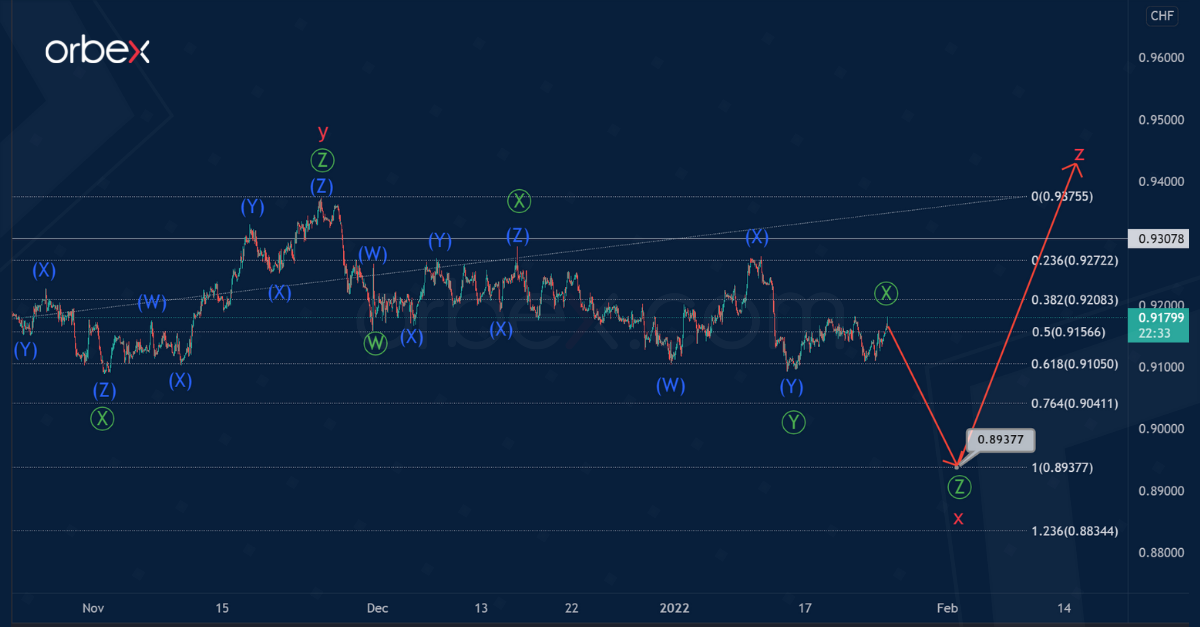
The current USDCHF formation indicates that at the end of November, the market completed the actionary wave y of the cycle degree, followed by a cycle intervening wave x.
Judging by the internal structure, the cycle intervening wave x can take the form of a primary triple zigzag Ⓦ-Ⓧ-Ⓨ-Ⓧ-Ⓩ. The sub-waves Ⓦ-Ⓧ-Ⓨ-Ⓧ already look completed. In the near future, the market will decline in the final wave Ⓩ.
Thus, in the short term, we can observe a drop in the wave Ⓩ to the level of 0.893. At that level, wave x will be at 100% of wave y.
After the end of wave x, the bulls can update the previous high of 0.937. The intervening wave y marked this level.
Free Reports:
 Get our Weekly Commitment of Traders Reports - See where the biggest traders (Hedge Funds and Commercial Hedgers) are positioned in the futures markets on a weekly basis.
 Download Our Metatrader 4 Indicators – Put Our Free MetaTrader 4 Custom Indicators on your charts when you join our Weekly Newsletter

An alternative scenario hints at a price increase. According to this scenario, the formation of the cycle intervening wave x is done. In fact, it has the form of a triple zigzag of the primary degree.
After the end of the reactionary intervening wave x, we saw the price rise and the development of the cycle wave z. Perhaps this wave takes the form of a primary double zigzag Ⓦ-Ⓧ-Ⓨ.
In addition, it seems that an intermediate triple zigzag was completed within the wave Ⓦ and the intervening wave Ⓧ. This took the form of a triple zigzag (W)-(X)-(Y)-(X)-(Z).
Soon, the exchange rate may rise in an intermediate double zigzag (W)-(X)-(Y) to the level of 0.951, where cycle waves z and y will be equal.
![]() Article by Orbex
Article by Orbex
Orbex is a fully licensed broker that was established in 2011. Founded with a mission to serve its traders responsibly and provides traders with access to the world’s largest and most liquid financial markets. www.orbex.com

- COT Metals Charts: Speculator Bets led by Silver, Gold & Platinum Mar 7, 2026
- COT Bonds Charts: Speculator Bets led by 10-Year Bonds & Fed Funds Mar 7, 2026
- COT Energy Charts: Speculator Bets led by Brent Oil & Heating Oil Mar 7, 2026
- COT Soft Commodities Charts: Speculator Bets led by Corn & Soybean Meal Mar 7, 2026
- Investors run to safe-haven assets amid Middle East escalation Mar 6, 2026
- EUR/USD Under Pressure: Middle East Risks Outweigh All Else Mar 6, 2026
- Bitcoin shows resilience to Middle East events. Oil market stabilizes Mar 5, 2026
- GBP/USD: Market Not Expecting BoE Rate Cut in March Mar 5, 2026
- Brent headed for $100? Mar 4, 2026
- Global stock indices continue sell-off due to Middle East conflict Mar 4, 2026