
By Dmitriy Gurkovskiy, Chief Analyst at RoboForex
EUR/USD is starting the final week of January with a decline towards 1.1320. The American currency is in demand due to investors’ interest in “safe haven” assets: the external background is looking rather pessimistic.
This week, market players will focus their attention on the US Fed session. It would be hard to overestimate the importance of this event. The entire financial world is expecting the American regulator to provide any hints at what the Fed is planning to do in March: raise the benchmark interest rate, announce the number of rate hikes in 2022, speak about the time of its balance reduction.
One may assume that in anticipation of the Fed’s comments and decisions investors will save their strengths and remain calm.
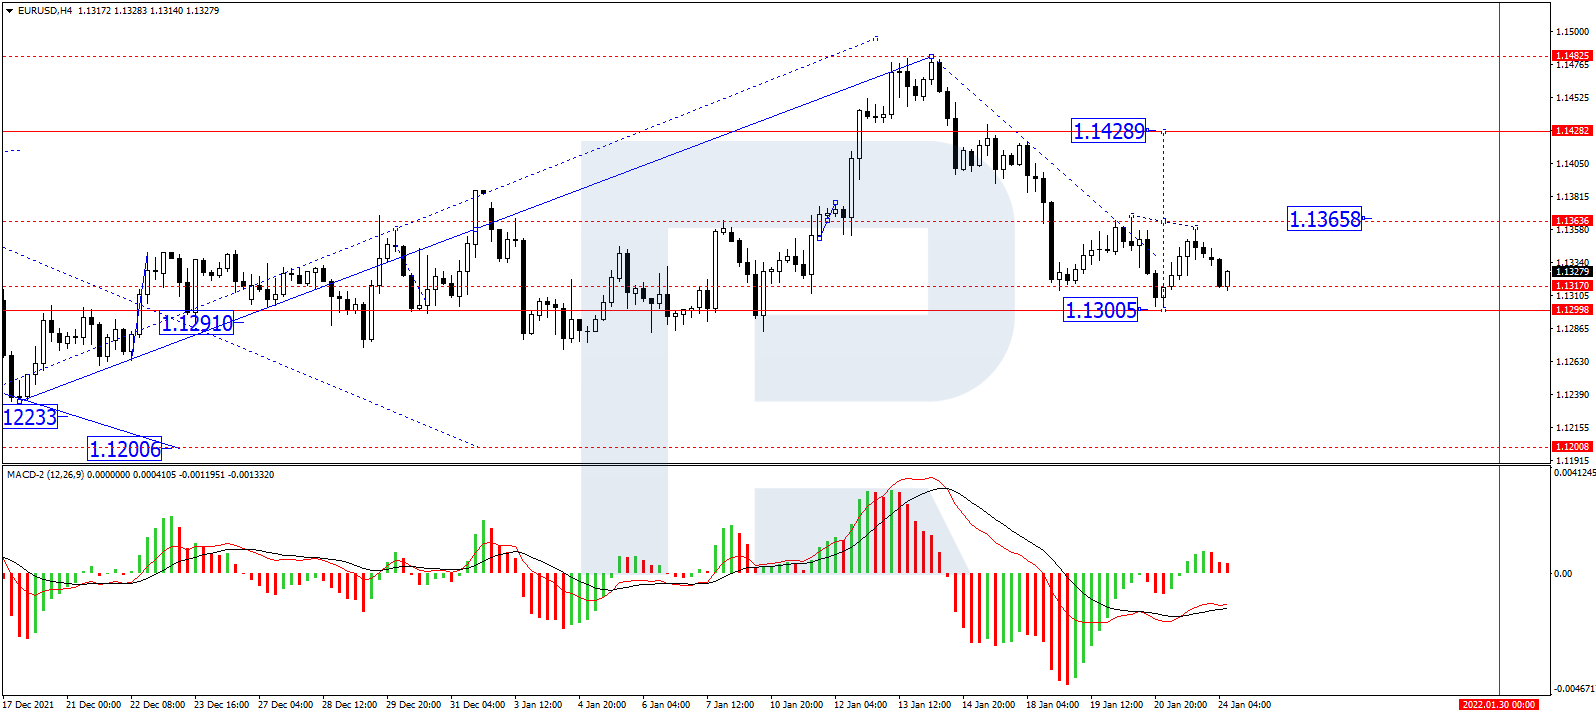
In the H4 chart, EUR/USD has finished another ascending wave at 1.1390; right now, it is correcting towards 1.1317 and may later form a new consolidation range near the lows. After that, the instrument may break the range to the upside and form one more ascending structure towards 1.1358 or even higher, to reach the first target at 1.1428. From the technical point of view, this scenario is confirmed by MACD Oscillator: its signal line is moving towards 0. After breaking this level, it may continue trading to reach new highs.
Free Reports:
 Download Our Metatrader 4 Indicators – Put Our Free MetaTrader 4 Custom Indicators on your charts when you join our Weekly Newsletter
 Get our Weekly Commitment of Traders Reports - See where the biggest traders (Hedge Funds and Commercial Hedgers) are positioned in the futures markets on a weekly basis.
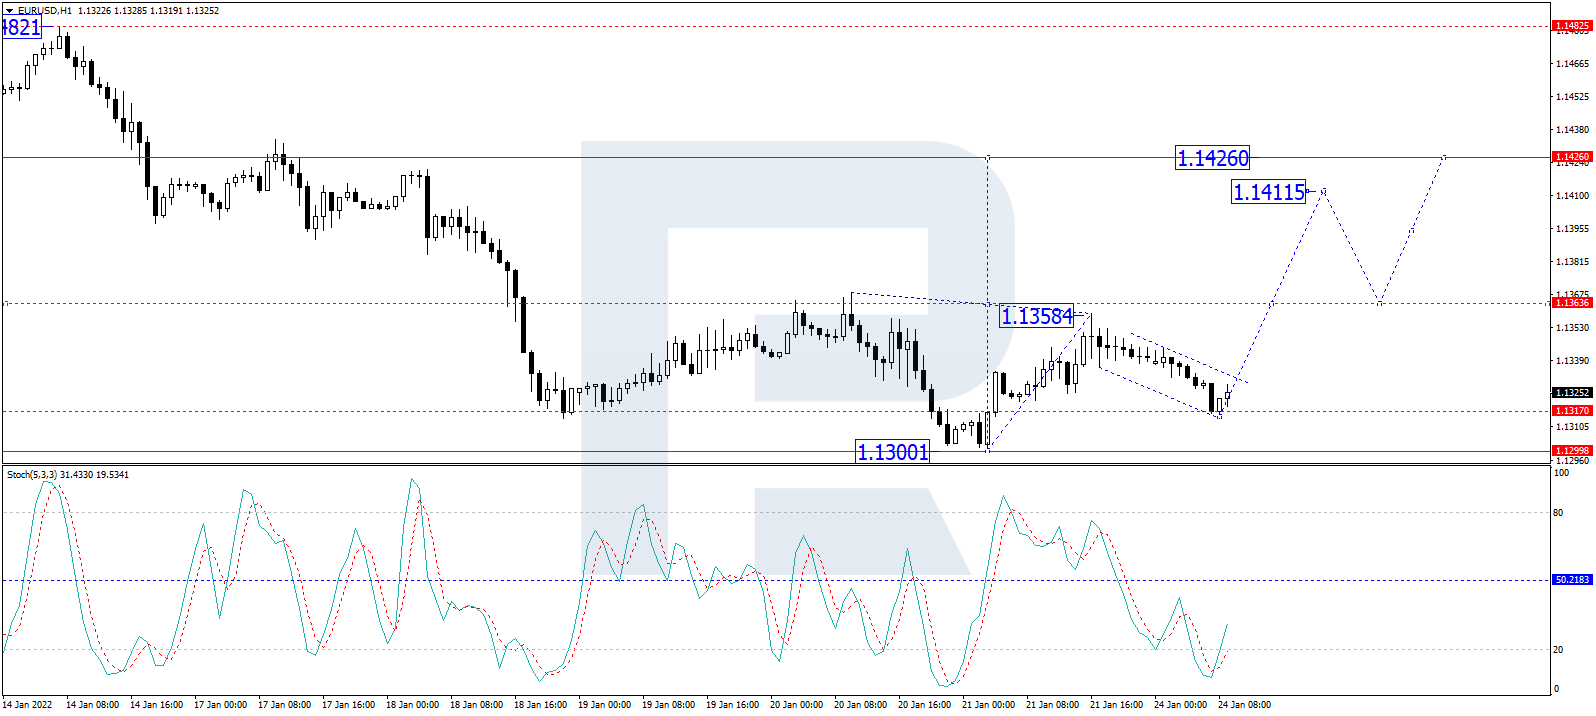
As we can see in the H1 chart, after completing the descending correction at 1.1317, EUR/USD is consolidating around this level. If later the price breaks this range to the upside, the market may form another ascending structure to break 1.1358. After that, the instrument may continue trading upwards with the short-term target at 1.1411. From the technical point of view, this idea is confirmed by the Stochastic Oscillator: after breaking 20, its signal line is growing to reach and break 50, thus boosting the price growth in the price chart.
Disclaimer
Any forecasts contained herein are based on the author’s particular opinion. This analysis may not be treated as trading advice. RoboForex bears no responsibility for trading results based on trading recommendations and reviews contained herein.

- COT Metals Charts: Speculator Bets led by Silver, Gold & Platinum Mar 7, 2026
- COT Bonds Charts: Speculator Bets led by 10-Year Bonds & Fed Funds Mar 7, 2026
- COT Energy Charts: Speculator Bets led by Brent Oil & Heating Oil Mar 7, 2026
- COT Soft Commodities Charts: Speculator Bets led by Corn & Soybean Meal Mar 7, 2026
- Investors run to safe-haven assets amid Middle East escalation Mar 6, 2026
- EUR/USD Under Pressure: Middle East Risks Outweigh All Else Mar 6, 2026
- Bitcoin shows resilience to Middle East events. Oil market stabilizes Mar 5, 2026
- GBP/USD: Market Not Expecting BoE Rate Cut in March Mar 5, 2026
- Brent headed for $100? Mar 4, 2026
- Global stock indices continue sell-off due to Middle East conflict Mar 4, 2026