
Article By RoboForex.com
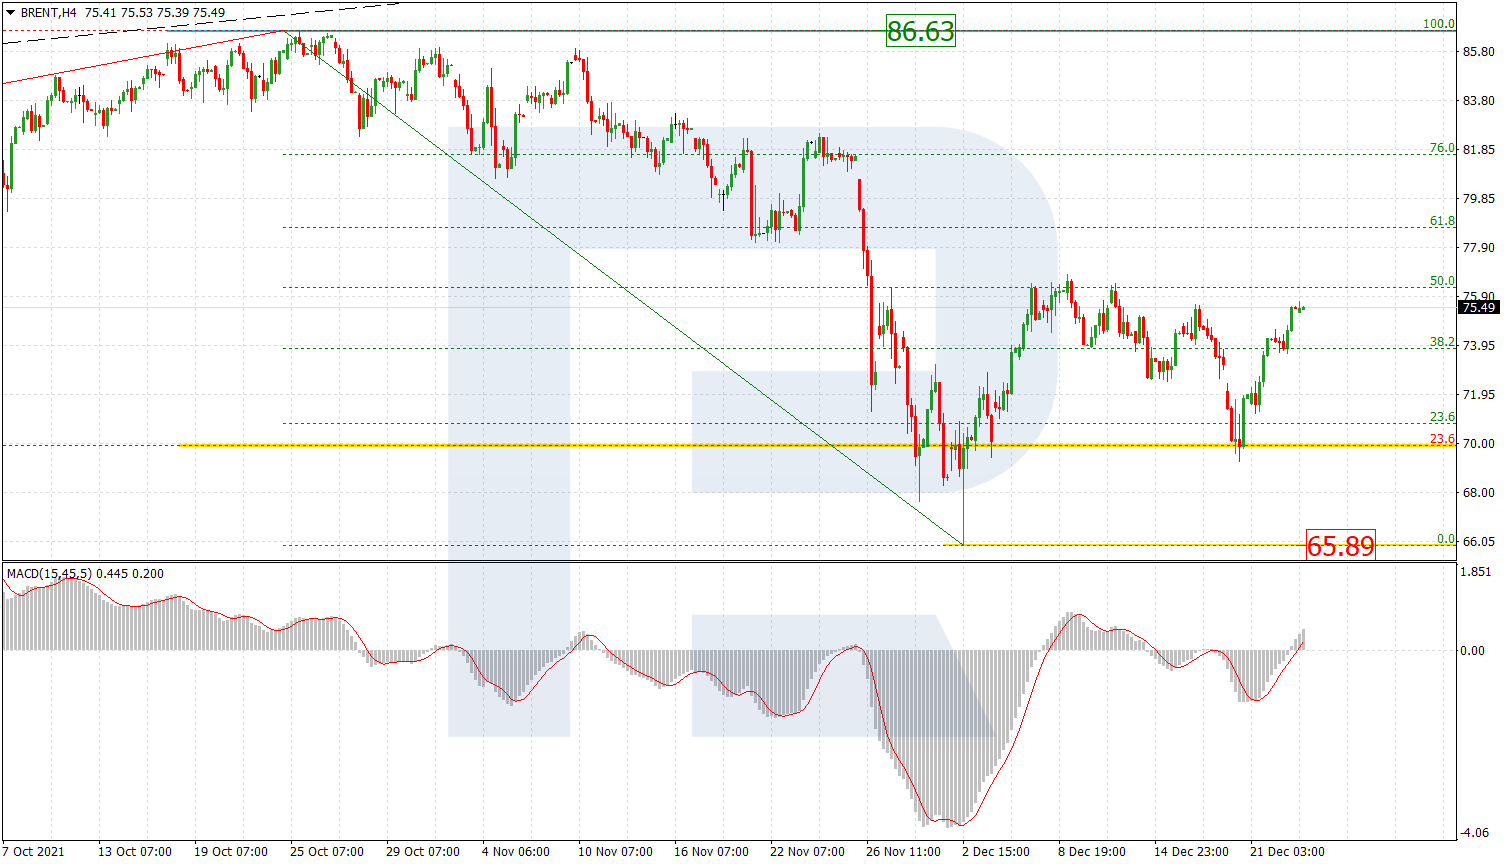
Brent
As we can see in the H4 chart, Brent is correcting upwards after attempting to reach the low 65.89. There is a possibility that the current ascending movement may attack the high at 86.63. However, if this wave fails to break the high and rebounds from it instead, the asset may start a new decline towards long-term 38.2%, 50.0%, and 61.8% fibo at 59.53, 51.20, and 42.86 respectively.

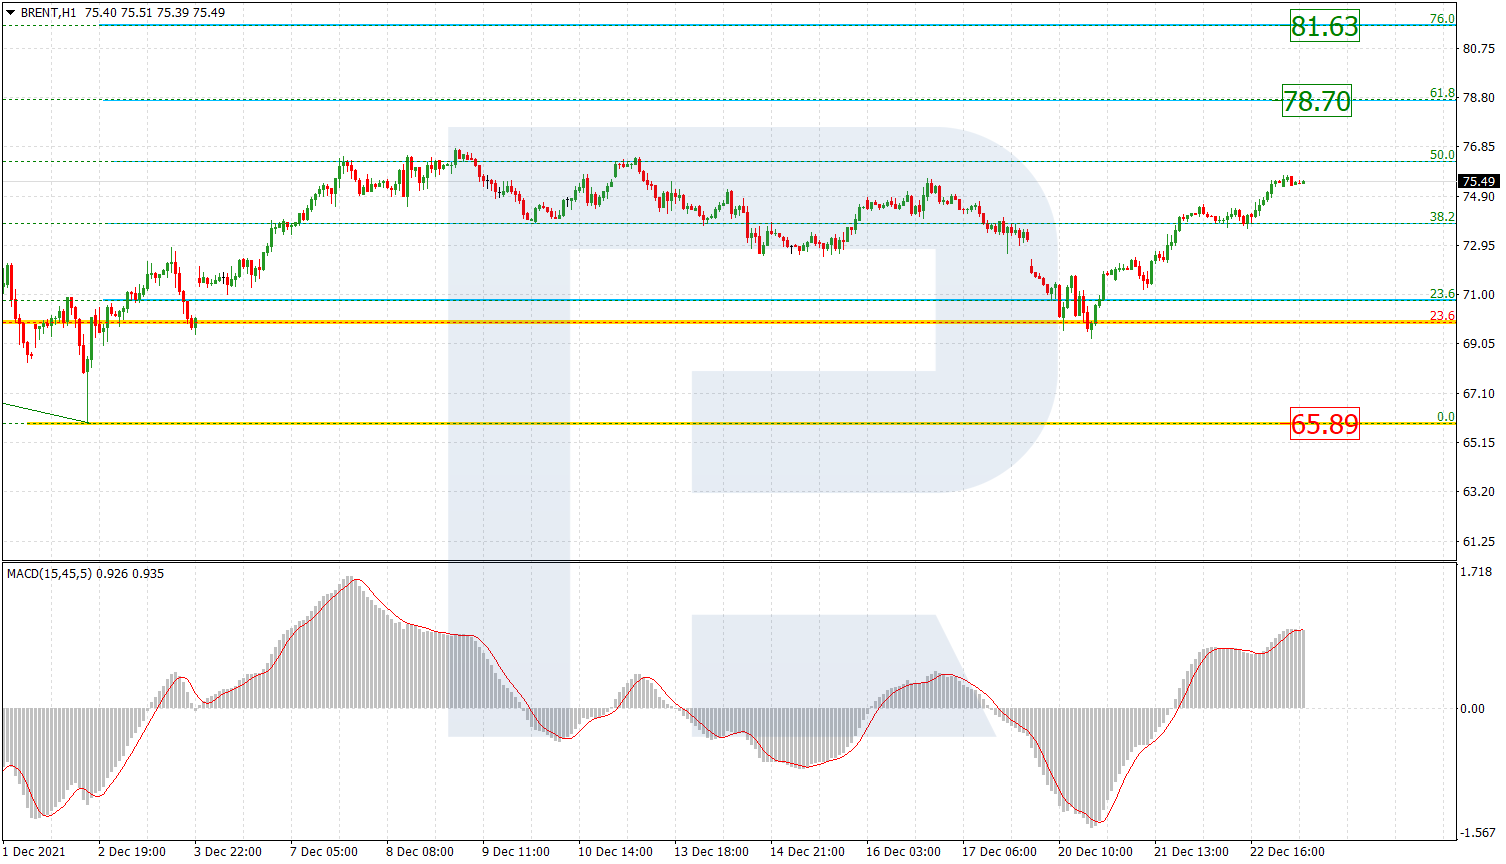
The H1 chart shows that the current correctional uptrend is trying to break 50.0% fibo again. If it succeeds, Brent may continue trading upwards to reach 61.8% and 76.0% fibo at 78.70 and 81.63 respectively.
Free Reports:
 Get our Weekly Commitment of Traders Reports - See where the biggest traders (Hedge Funds and Commercial Hedgers) are positioned in the futures markets on a weekly basis.
 Download Our Metatrader 4 Indicators – Put Our Free MetaTrader 4 Custom Indicators on your charts when you join our Weekly Newsletter
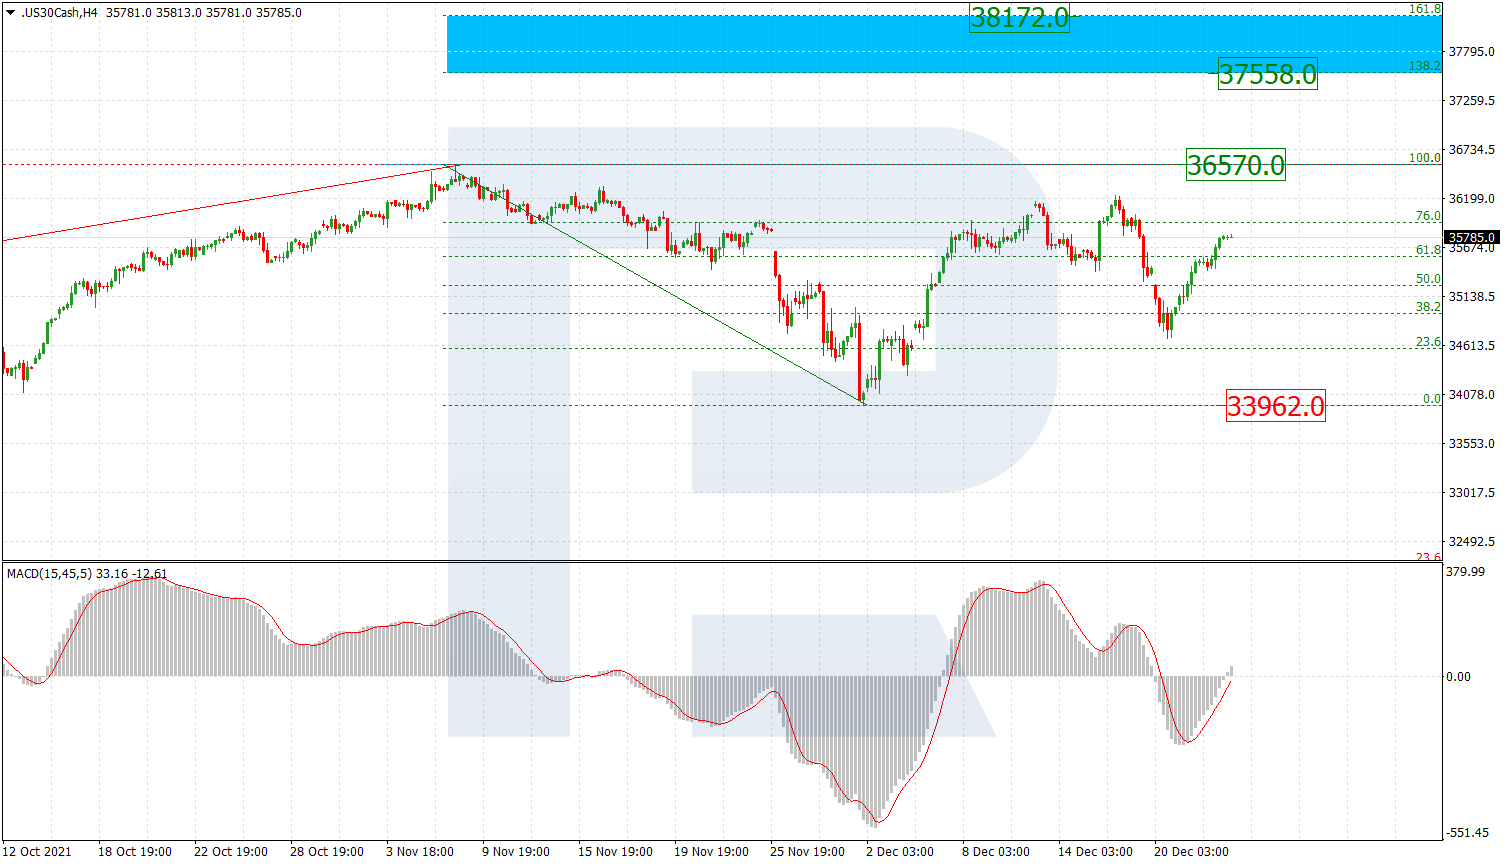
Dow Jones
As we can see in the H4chart, after completing the descending wave, the index is steadily growing. if the asset breaks the high at 36570.0, it may continue trading upwards to reach the post-correctional extension area between 138.2% and 161.8% fibo at 37558.0 and 38172.0 respectively. Otherwise, the instrument may start a new decline towards the support at 33962.0.
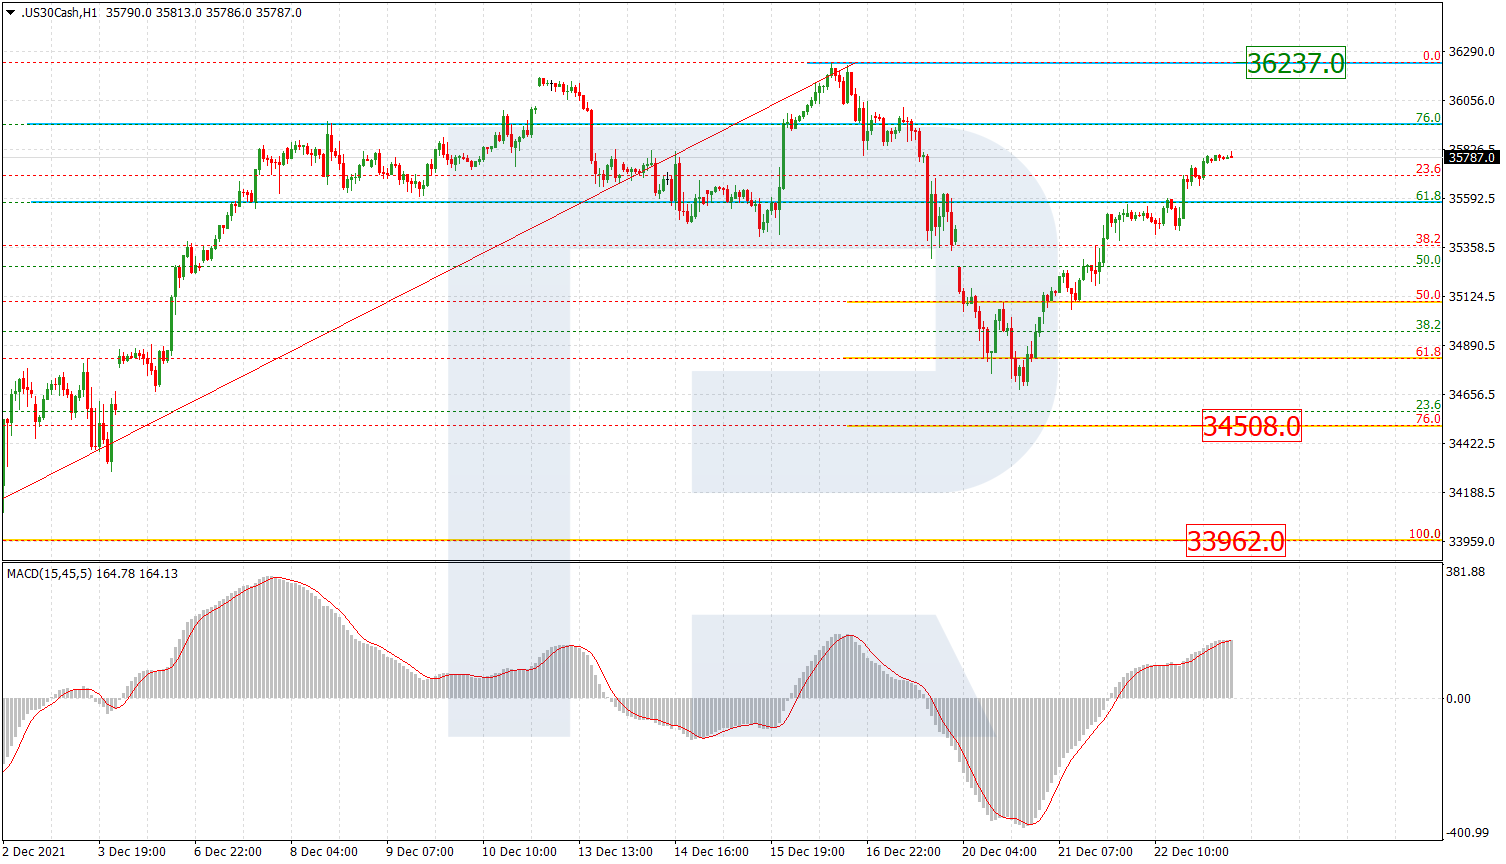
In the H1 chart, divergence on MACD made the index stop falling at 61.8% fibo and start a new growth, which is heading to break the resistance at 36237.0. However, another scenario implies a reversal and a new decline towards 76.0% fibo and the low at 34508.0 and 33962.0 respectively.
Article By RoboForex.com
Attention!
Forecasts presented in this section only reflect the author’s private opinion and should not be considered as guidance for trading. RoboForex LP bears no responsibility for trading results based on trading recommendations described in these analytical reviews.

- Trump signals de-escalation in the Middle East; China’s trade surplus hits a new record Mar 10, 2026
- EUR/USD in Turbulence: Market Questions When Conflict Over Iran Will End Mar 10, 2026
- Prices push oil above $100 per barrel Mar 9, 2026
- COT Metals Charts: Speculator Bets led by Silver, Gold & Platinum Mar 7, 2026
- COT Bonds Charts: Speculator Bets led by 10-Year Bonds & Fed Funds Mar 7, 2026
- COT Energy Charts: Speculator Bets led by Brent Oil & Heating Oil Mar 7, 2026
- COT Soft Commodities Charts: Speculator Bets led by Corn & Soybean Meal Mar 7, 2026
- Investors run to safe-haven assets amid Middle East escalation Mar 6, 2026
- EUR/USD Under Pressure: Middle East Risks Outweigh All Else Mar 6, 2026
- Bitcoin shows resilience to Middle East events. Oil market stabilizes Mar 5, 2026