
By Dmitriy Gurkovskiy, Chief Analyst at RoboForex
Early in the new week of October, EUR/USD is looking good and trading at 1.1660. the factor that supports the European currency is the global risk attitude.
So far, the US Fed hasn’t given any signals of the QE programme reduction in November. This fact upsets the “greenback” enthusiasts, who obviously decided to take a break and wait for any relevant news.
This week, the European Central Bank is scheduled to have a meeting, where it is expected to keep its monetary policy aspects intact. It will be very interesting to hear the regulator’s comments about the stimulus, which is currently not expected to change.
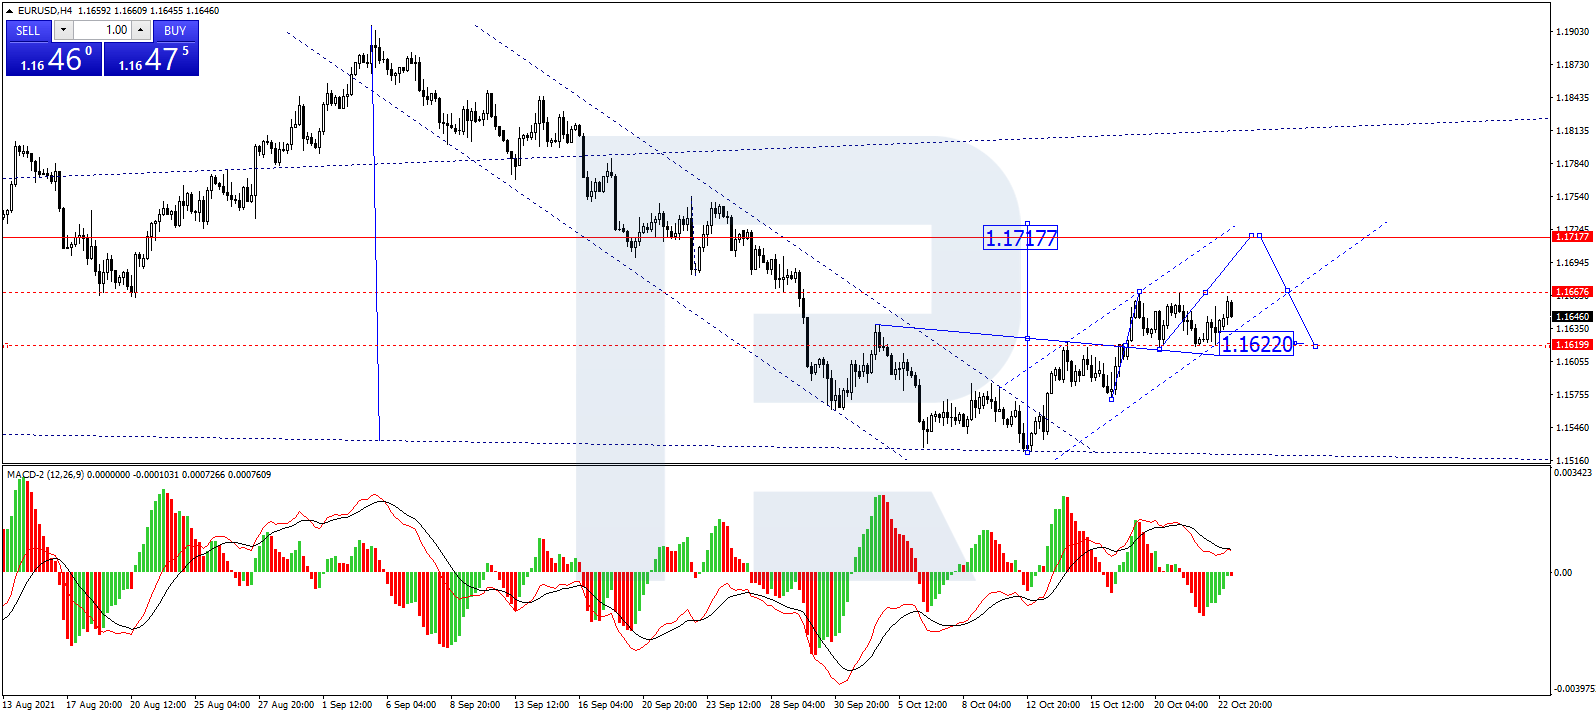
In the H4 chart, EUR/USD has formed a consolidation range around 1.1642 in the form of a Triangle pattern. Possibly, the pair may break the range and grow to reach the pattern’s upside border at 1.1685. If later the price breaks this level to the upside, the market may continue trading upwards with the target at 1.1710 (at least). From the technical point of view, this scenario is confirmed by MACD Oscillator: its signal line is moving above 0, while histograms are showing a steady wave to the upside.
Free Reports:
 Sign Up for Our Stock Market Newsletter – Get updated on News, Charts & Rankings of Public Companies when you join our Stocks Newsletter
 Get our Weekly Commitment of Traders Reports - See where the biggest traders (Hedge Funds and Commercial Hedgers) are positioned in the futures markets on a weekly basis.
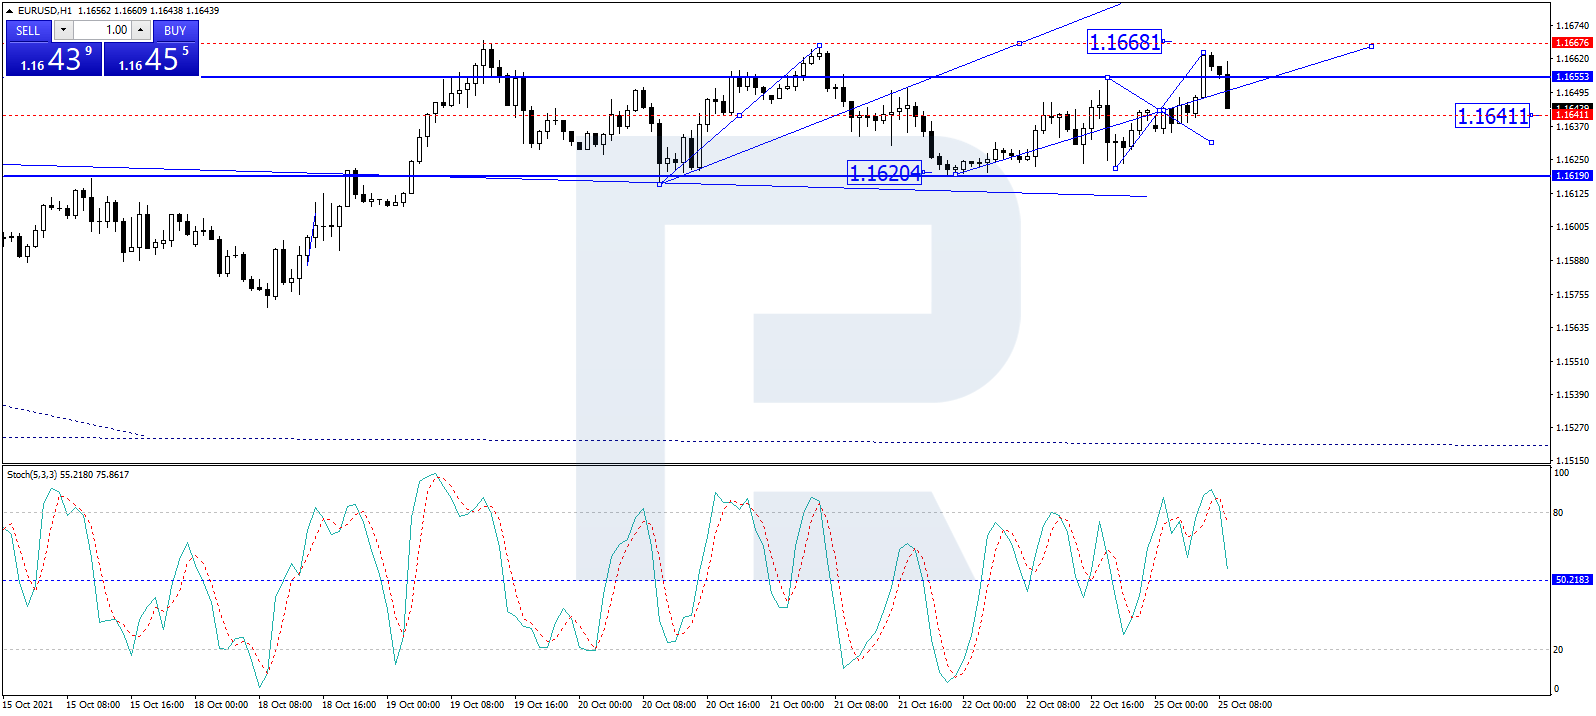
As we can see in the H1 chart, after rebounding from 1.1664 to the downside, EUR/USD is falling towards 1.1642. Possibly, the pair may rebound from the latter level and resume growing to reach 1.1688. After that, the instrument may break this level as well and continue trading upwards with the target at 1.1710. From the technical point of view, this scenario is confirmed by the Stochastic Oscillator: its signal line is moving below 80. Later, the line is expected to fall towards 50, a rebound from which may lead to another growth to reach 80.
Disclaimer
Any forecasts contained herein are based on the author’s particular opinion. This analysis may not be treated as trading advice. RoboForex bears no responsibility for trading results based on trading recommendations and reviews contained herein.

- COT Metals Charts: Speculator Bets led by Silver, Gold & Platinum Mar 7, 2026
- COT Bonds Charts: Speculator Bets led by 10-Year Bonds & Fed Funds Mar 7, 2026
- COT Energy Charts: Speculator Bets led by Brent Oil & Heating Oil Mar 7, 2026
- COT Soft Commodities Charts: Speculator Bets led by Corn & Soybean Meal Mar 7, 2026
- Investors run to safe-haven assets amid Middle East escalation Mar 6, 2026
- EUR/USD Under Pressure: Middle East Risks Outweigh All Else Mar 6, 2026
- Bitcoin shows resilience to Middle East events. Oil market stabilizes Mar 5, 2026
- GBP/USD: Market Not Expecting BoE Rate Cut in March Mar 5, 2026
- Brent headed for $100? Mar 4, 2026
- Global stock indices continue sell-off due to Middle East conflict Mar 4, 2026