
By Dmitriy Gurkovskiy, Chief Analyst at RoboForex
The oil price is falling after rallying before. Early in another September week, Brent is trading at $74.50 and has a lot of room to correct.
The strong “greenback” prevents investors from buying, although the asset is looking too expensive even without this driver.
On top of that, the Oil Rig Count in the USA continues growing: it added 10 units over the week and now equals 411. After the Ida storm that raged in the Gulf of Mexico early in September, the majority of rigs are back to normal operation.
In the H4 chart, after forming another consolidation range around 74.00 and breaking it to the upside, Brent has reached the next upside target at 76.20; right now, it is correcting towards 74.30. Later, the market may form one more ascending structure to break 76.00 and then continue growing with the short-term target at 77.70. On the other hand, if the price rebounds from 76.00 and falls to break 73.30, the instrument may continue the correction towards 72.00. After that, the asset may resume trading upwards to reach the above-mentioned target. From the technical point of view, this scenario is confirmed by MACD Oscillator: its signal line is falling towards 0. Possibly, the line may rebound to the upside and resume moving upwards to reach new highs.

Free Reports:
 Get our Weekly Commitment of Traders Reports - See where the biggest traders (Hedge Funds and Commercial Hedgers) are positioned in the futures markets on a weekly basis.
 Download Our Metatrader 4 Indicators – Put Our Free MetaTrader 4 Custom Indicators on your charts when you join our Weekly Newsletter
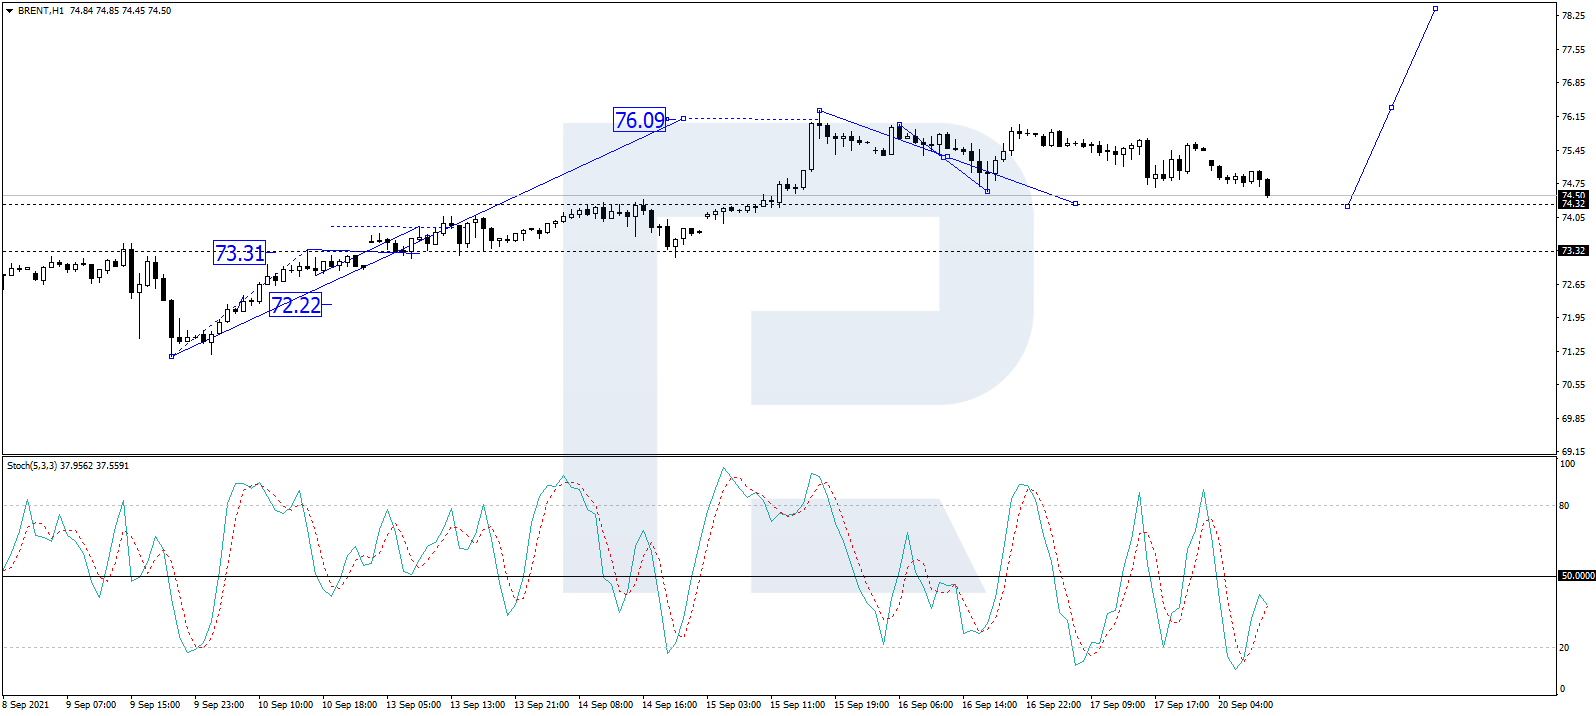
As we can see in the H1 chart, after completing the ascending wave at 76.09, Brent is correcting in the form of a Flag pattern towards 74.33. Possibly, the asset may break this correctional channel to the upside to reach 76.00 and then consolidate around this level. If later the price breaks this range to the downside, the market may continue the correction towards 73.30; if to the upside – resume trading within the uptrend with the target at 77.70. From the technical point of view, this idea is confirmed by the Stochastic Oscillator: After rebounding from 20, its signal line is moving to break 50 and continue growing to reach 80.

- Oil prices jumped 4% amid a new wave of escalation between the US and Iran Jul 13, 2026
- EUR/USD: US Inflation Will Determine Everything Jul 13, 2026
- COT Metals Charts: Weekly Speculator Bets see small gains for Silver & Gold Jul 12, 2026
- COT Bonds Charts: Speculator Bets led by SOFR 3-Months & 2-Year Bonds Jul 12, 2026
- COT Energy Charts: Weekly Speculator Changes led by Brent Oil Jul 12, 2026
- COT Soft Commodities Charts: Weekly Speculator Changes led by Sugar, Corn & Soybeans Jul 12, 2026
- The US and European stock indices are rising again amid renewed investor interest in the AI industry. Jul 10, 2026
- USD/JPY Falls as Yen Recovers Weekly Losses Jul 10, 2026
- Crude oil prices surged sharply by 7% in reaction to the rapid escalation of the conflict in the Middle East Jul 9, 2026
- Middle East Tensions Weigh on Gold Jul 9, 2026