
Article By RoboForex.com
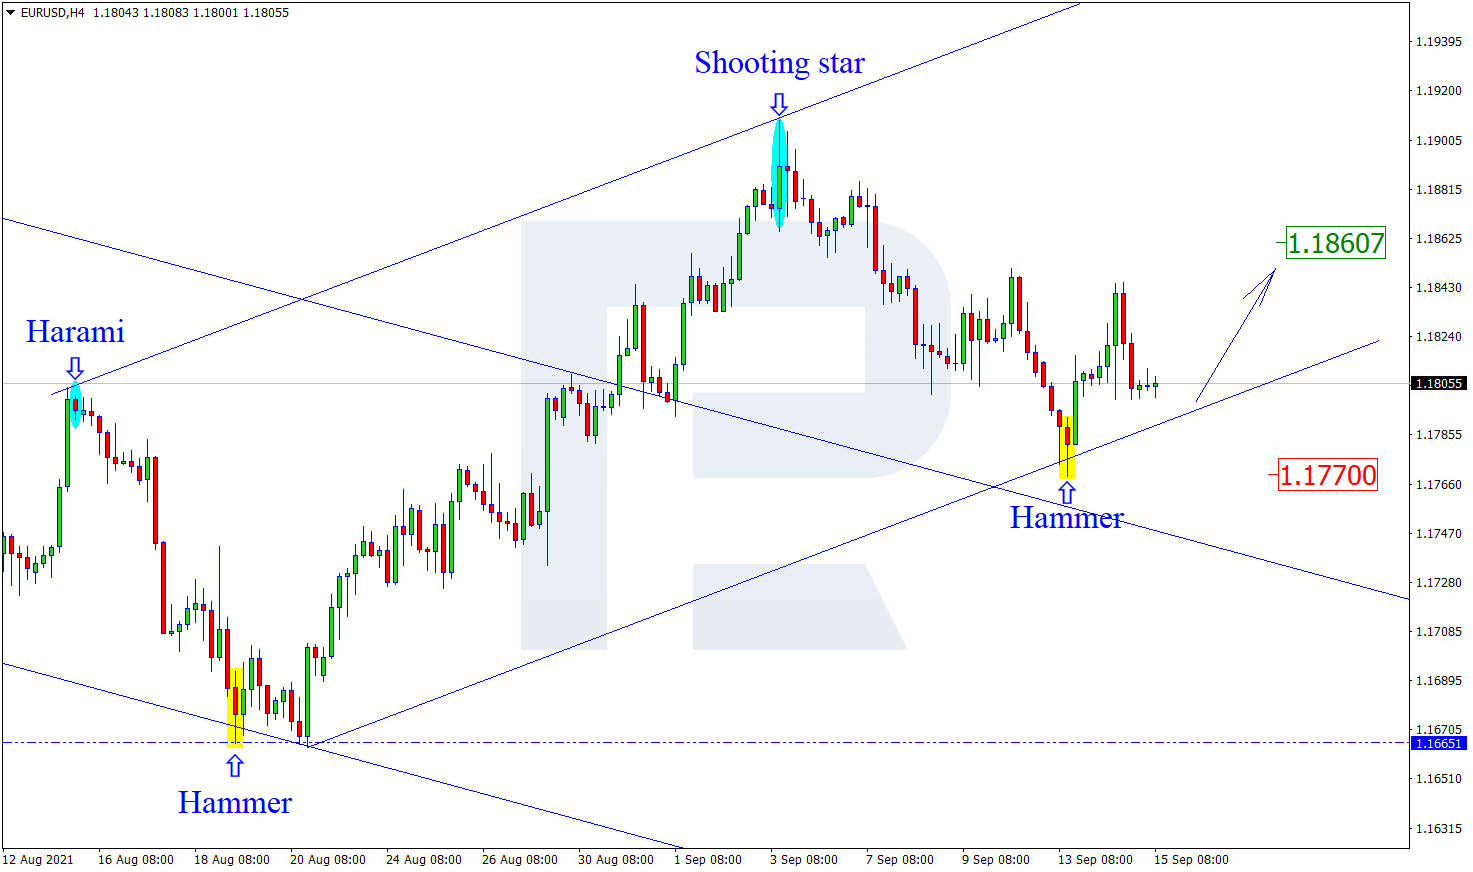
EURUSD, “Euro vs US Dollar”
As we can see in the H4 chart, the asset has formed several reversal patterns, including Hammer, not far from the support level. At the moment, EURUSD may reverse and start a new growth. In this case, the upside target may be at 1.1860. Later, the market may break the resistance area and continue trading upwards. However, an alternative scenario implies that the price may correct to reach 1.1770 first and then resume growing.

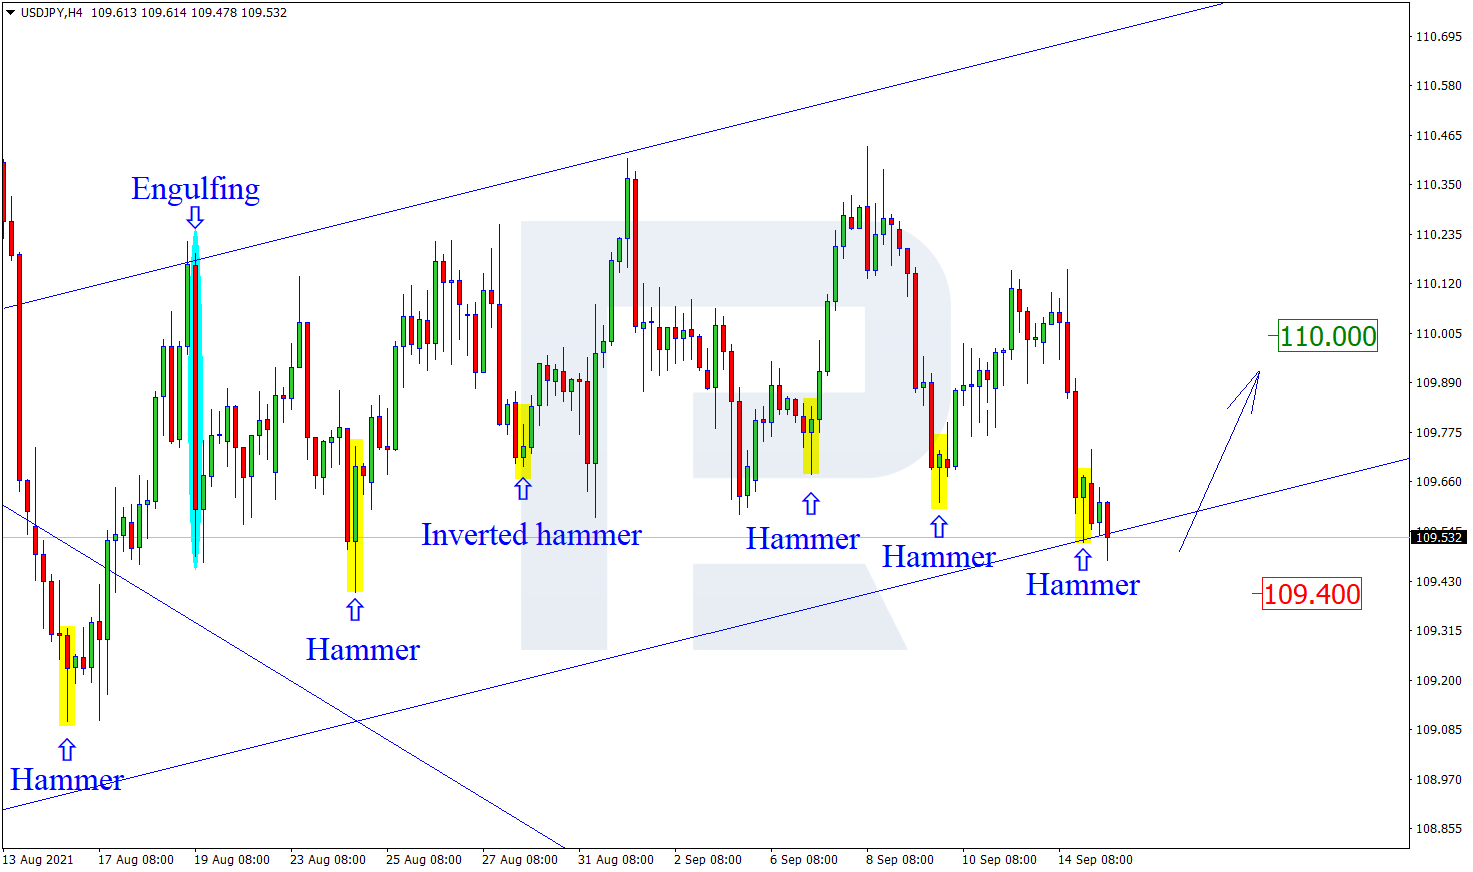
USDJPY, “US Dollar vs Japanese Yen”
As we can see in the H4 chart, USDJPY has formed a Hammer pattern close to the support area. At the moment, USDJPY is reversing and may start a new growth towards 110.00. At the same time, an opposite scenario implies that the price may correct to reach 109.40 before resuming its ascending tendency.
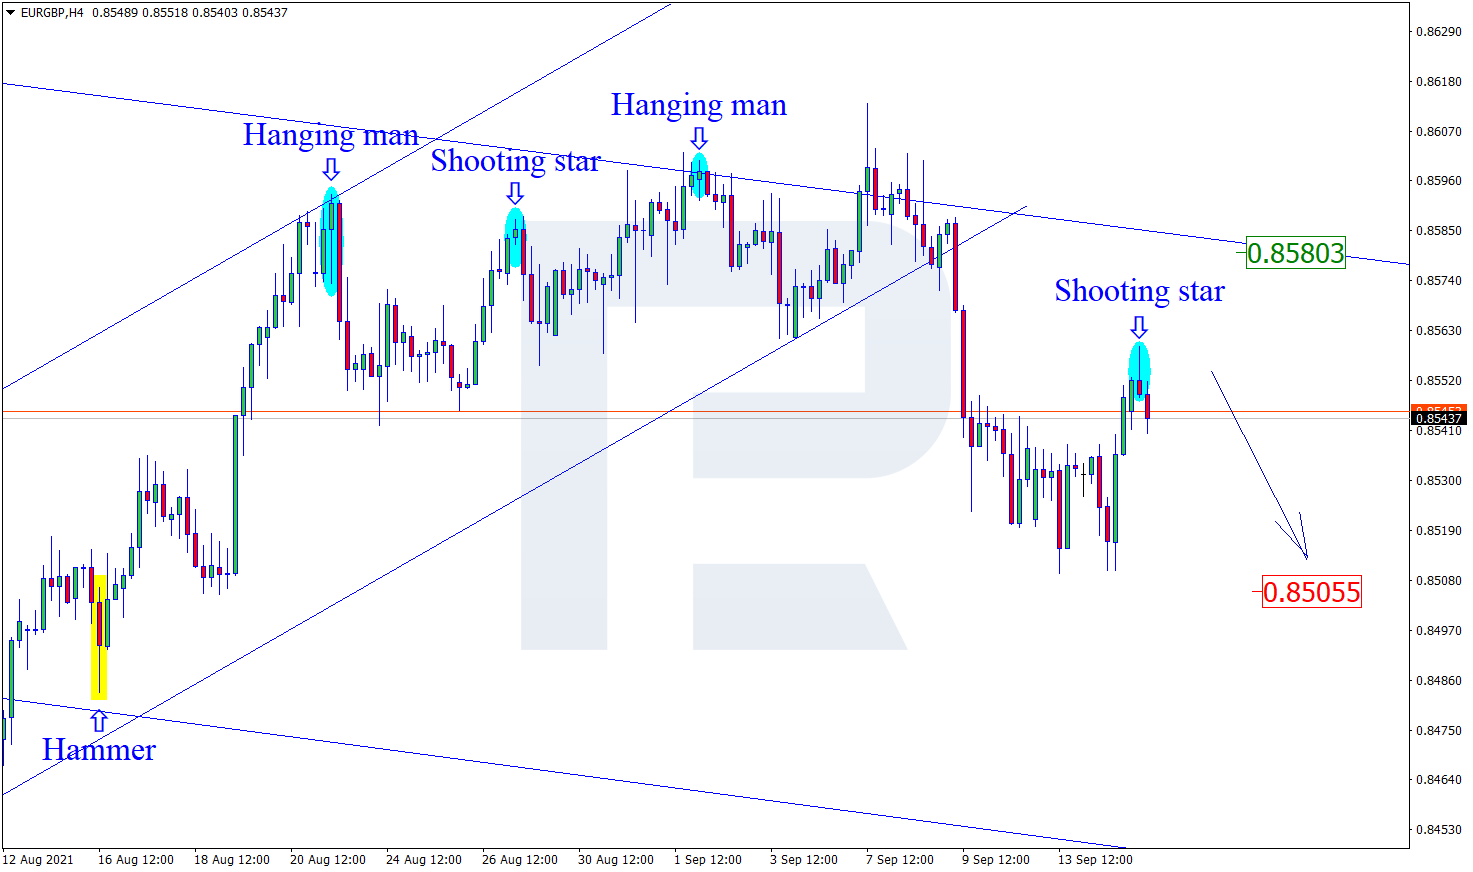
EURGBP, “Euro vs Great Britain Pound”
As we can see in the H4 chart, after forming a Shooting Star pattern during the pullback, EURGBP may reverse in the form of a new decline. In this case, the downside target may be at 0.8505. Later, the market may test the support area, break it, and continue the descending tendency. Still, there might be an alternative scenario, according to which the asset may correct towards 0.8580 first and then resume falling.
Article By RoboForex.com
Attention!
Forecasts presented in this section only reflect the author’s private opinion and should not be considered as guidance for trading. RoboForex LP bears no responsibility for trading results based on trading recommendations described in these analytical reviews.