
Article By RoboForex.com
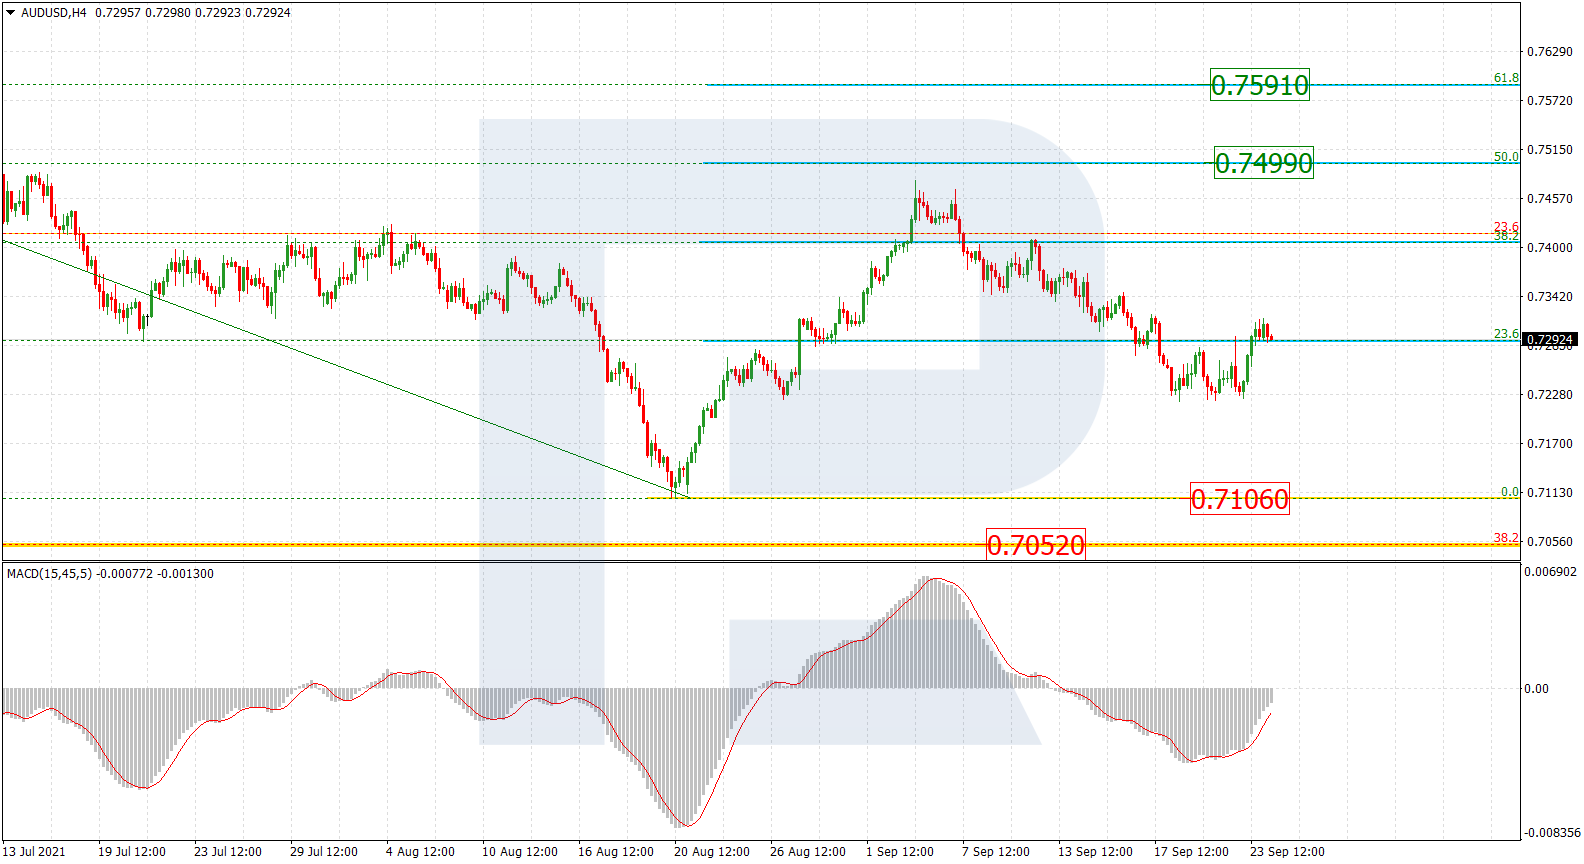
AUDUSD, “Australian Dollar vs US Dollar”
As we can see in the H4 chart, the asset is correcting within the downtrend. Possibly, this pullback may transform into a new rising wave to reach 50.0% and 61.8% fibo at 0.7499 and 0.7591 respectively. However, the main scenario implies a further downtrend towards the low and the mid-term 38.2% fibo at 0.7106 and 0.7052 respectively.

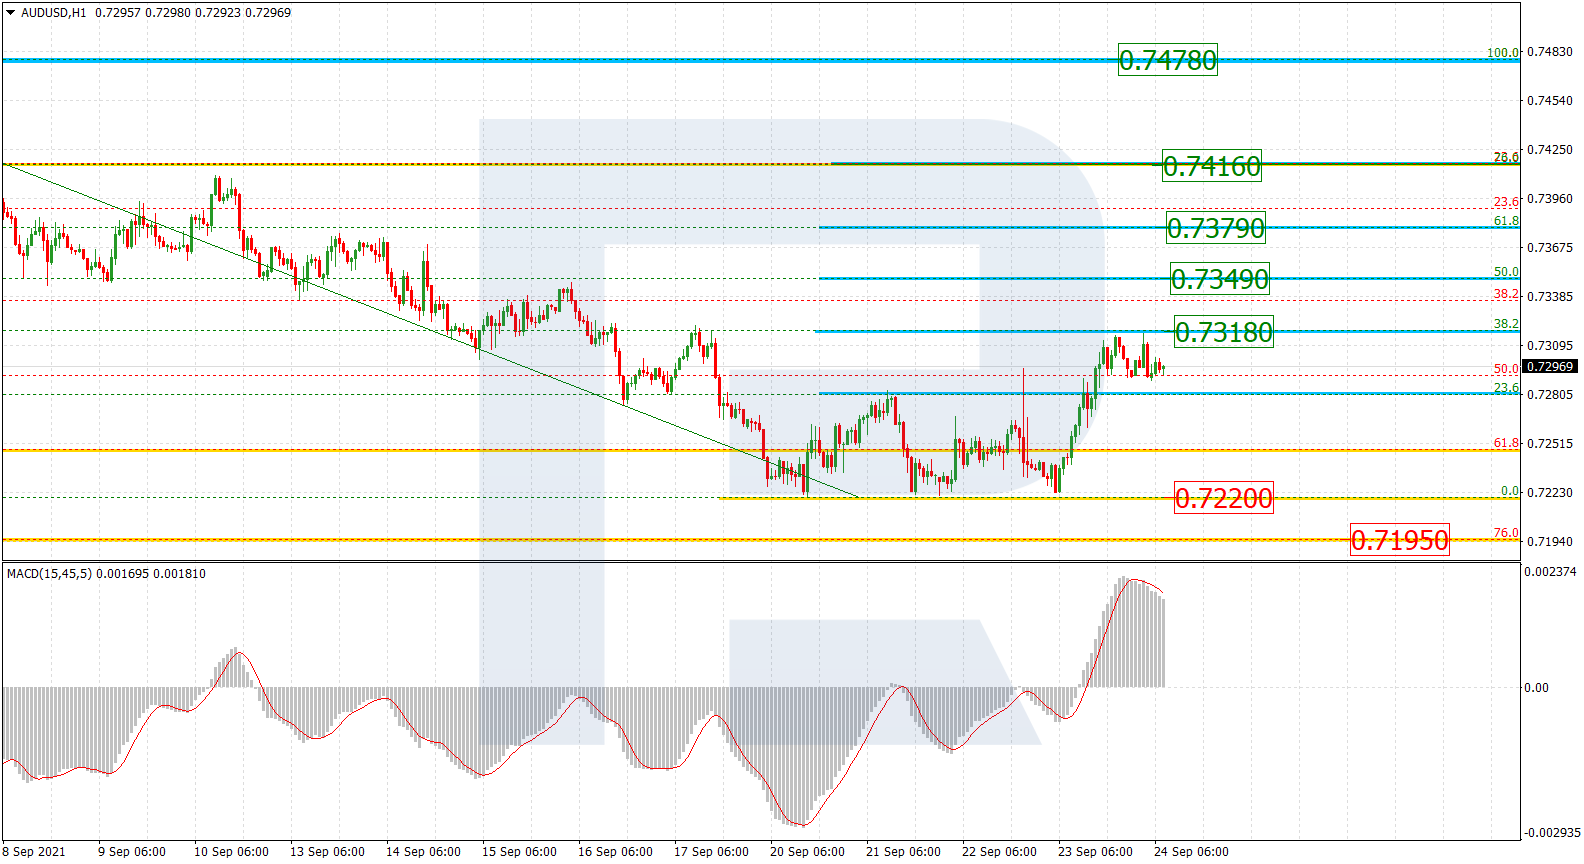
The H1 chart of AUDUSD shows the potential targets of the short-term ascending correction. The asset has already tested 38.2% fibo at 0.7318 and may later continue towards 50.0% and 61.8% fibo at 0.7349 and 0.7379 respectively. If the price is able to reach 76.0% fibo at 0.7416, it may continue growing towards the resistance at 0.7478 or even higher.
Free Reports:
 Get our Weekly Commitment of Traders Reports - See where the biggest traders (Hedge Funds and Commercial Hedgers) are positioned in the futures markets on a weekly basis.
 Sign Up for Our Stock Market Newsletter – Get updated on News, Charts & Rankings of Public Companies when you join our Stocks Newsletter
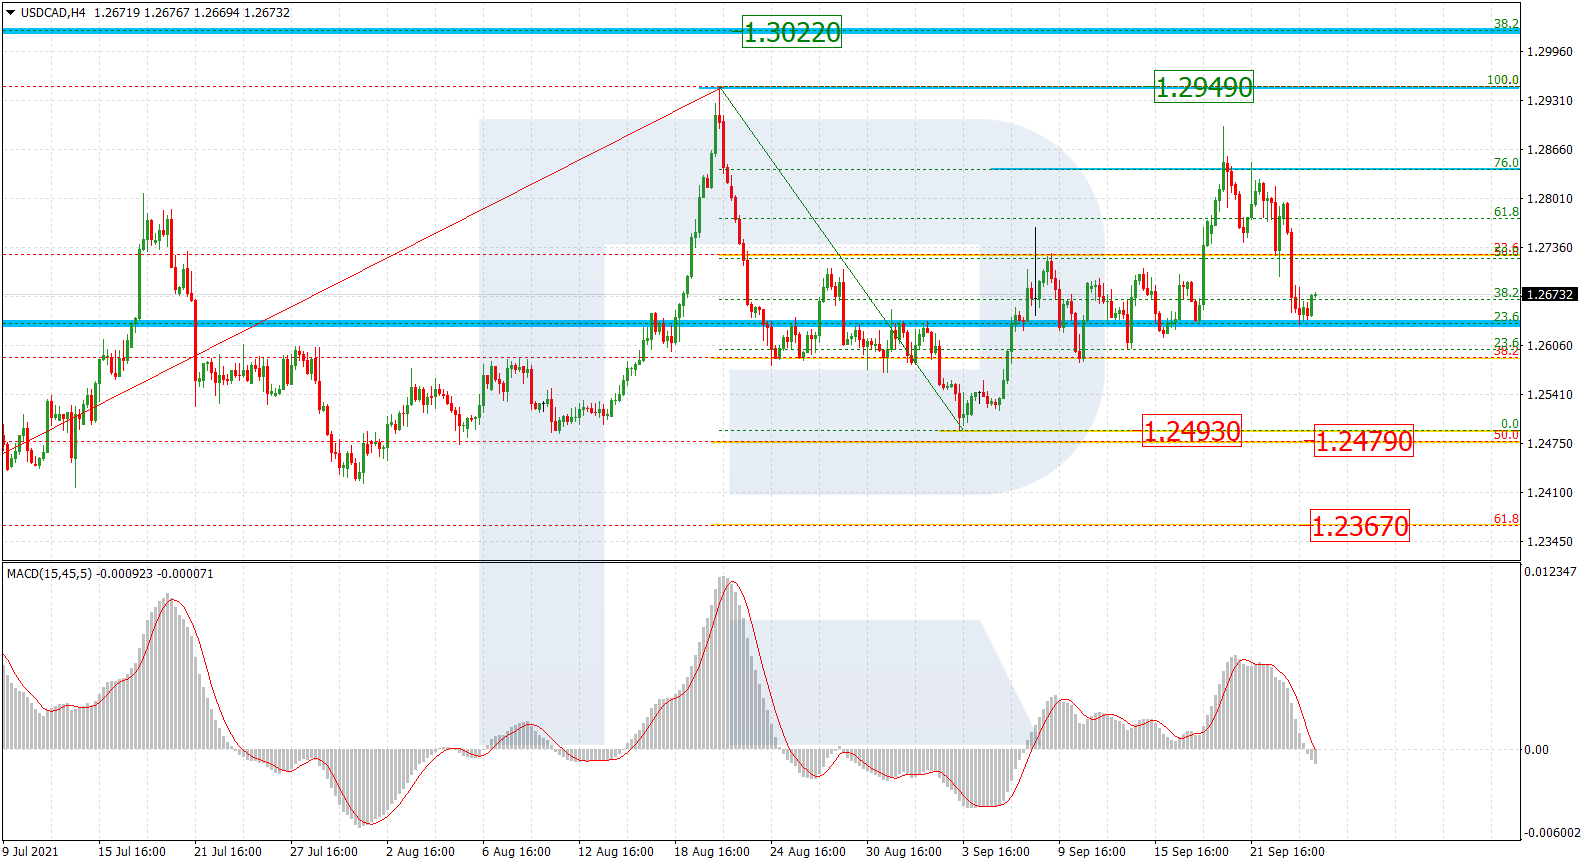
USDCAD, “US Dollar vs Canadian Dollar”
As we can see in the H4 chart, after an attempt to grow and reach the high at 1.2949, the pair is forming a new wave to the downside. If later the price does break the high, the asset may continue trading within the uptrend towards the long-term target, which is 38.2% fibo at 1.3022. However, the closest target of the current decline is the support at the low (1.2493), a breakout of which may lead to a further downtrend towards 50.0% and 61.8% fibo at 1.2479 and 1.2367 respectively.
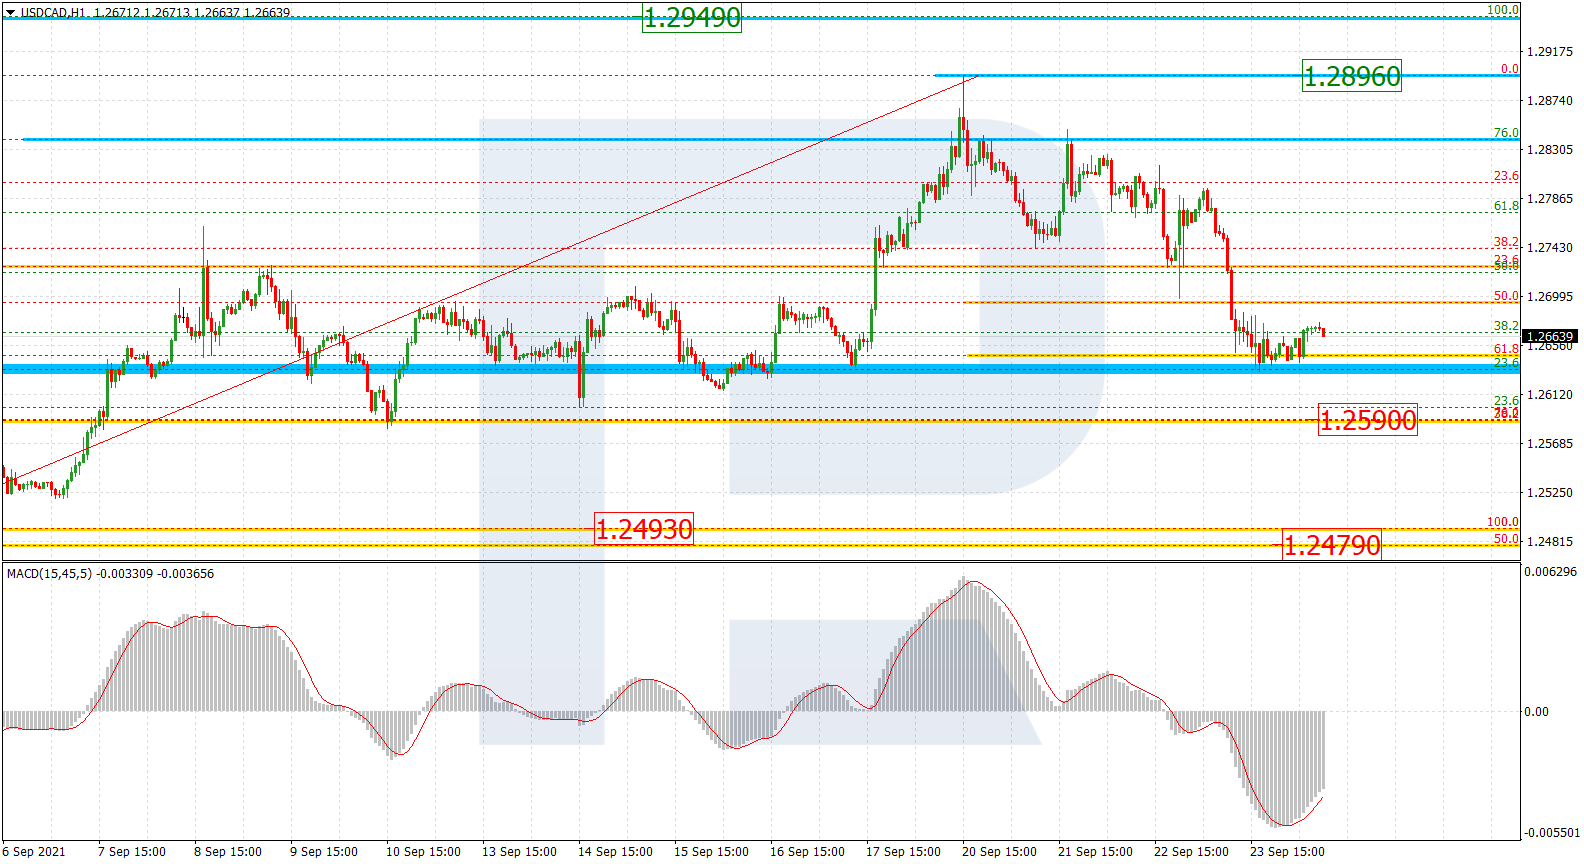
The H1 chart shows a more detailed structure of the current descending wave, which has already reached 61.8% fibo. The next downside target is 76.0% fibo at 1.2590 respectively, as well as the low at 1.2493.
Article By RoboForex.com
Attention!
Forecasts presented in this section only reflect the author’s private opinion and should not be considered as guidance for trading. RoboForex LP bears no responsibility for trading results based on trading recommendations described in these analytical reviews.

- Prices push oil above $100 per barrel Mar 9, 2026
- COT Metals Charts: Speculator Bets led by Silver, Gold & Platinum Mar 7, 2026
- COT Bonds Charts: Speculator Bets led by 10-Year Bonds & Fed Funds Mar 7, 2026
- COT Energy Charts: Speculator Bets led by Brent Oil & Heating Oil Mar 7, 2026
- COT Soft Commodities Charts: Speculator Bets led by Corn & Soybean Meal Mar 7, 2026
- Investors run to safe-haven assets amid Middle East escalation Mar 6, 2026
- EUR/USD Under Pressure: Middle East Risks Outweigh All Else Mar 6, 2026
- Bitcoin shows resilience to Middle East events. Oil market stabilizes Mar 5, 2026
- GBP/USD: Market Not Expecting BoE Rate Cut in March Mar 5, 2026
- Brent headed for $100? Mar 4, 2026