
Article By RoboForex.com
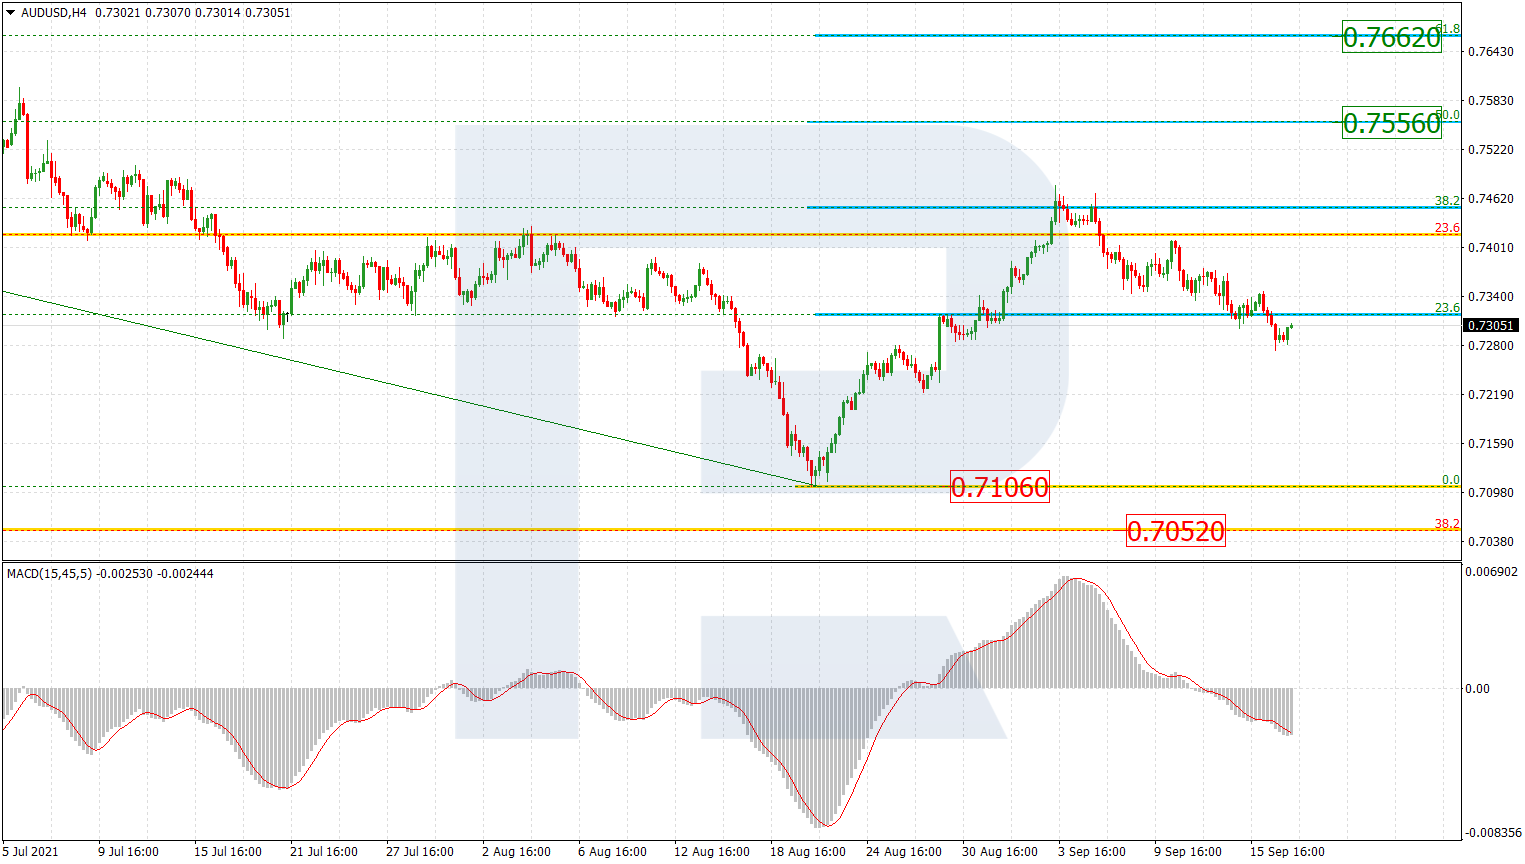
AUDUSD, “Australian Dollar vs US Dollar”
As we can see in the H4 chart, after growing and reaching 38.2% fibo, AUDUSD is forming a new descending wave that may seem to be heading to break the low at 0.7106 and then reach the mid-term 38.2% fibo at 0.7052. However, this wave should be considered as a correction relative to the previous ascending wave, which, in its turn, might be a part of the correctional phase of the previous downtrend. After the current pullback is over, the asset may resume growing towards 50.0% and 61.8% fibo at 0.7556 and 0.7662 respectively.

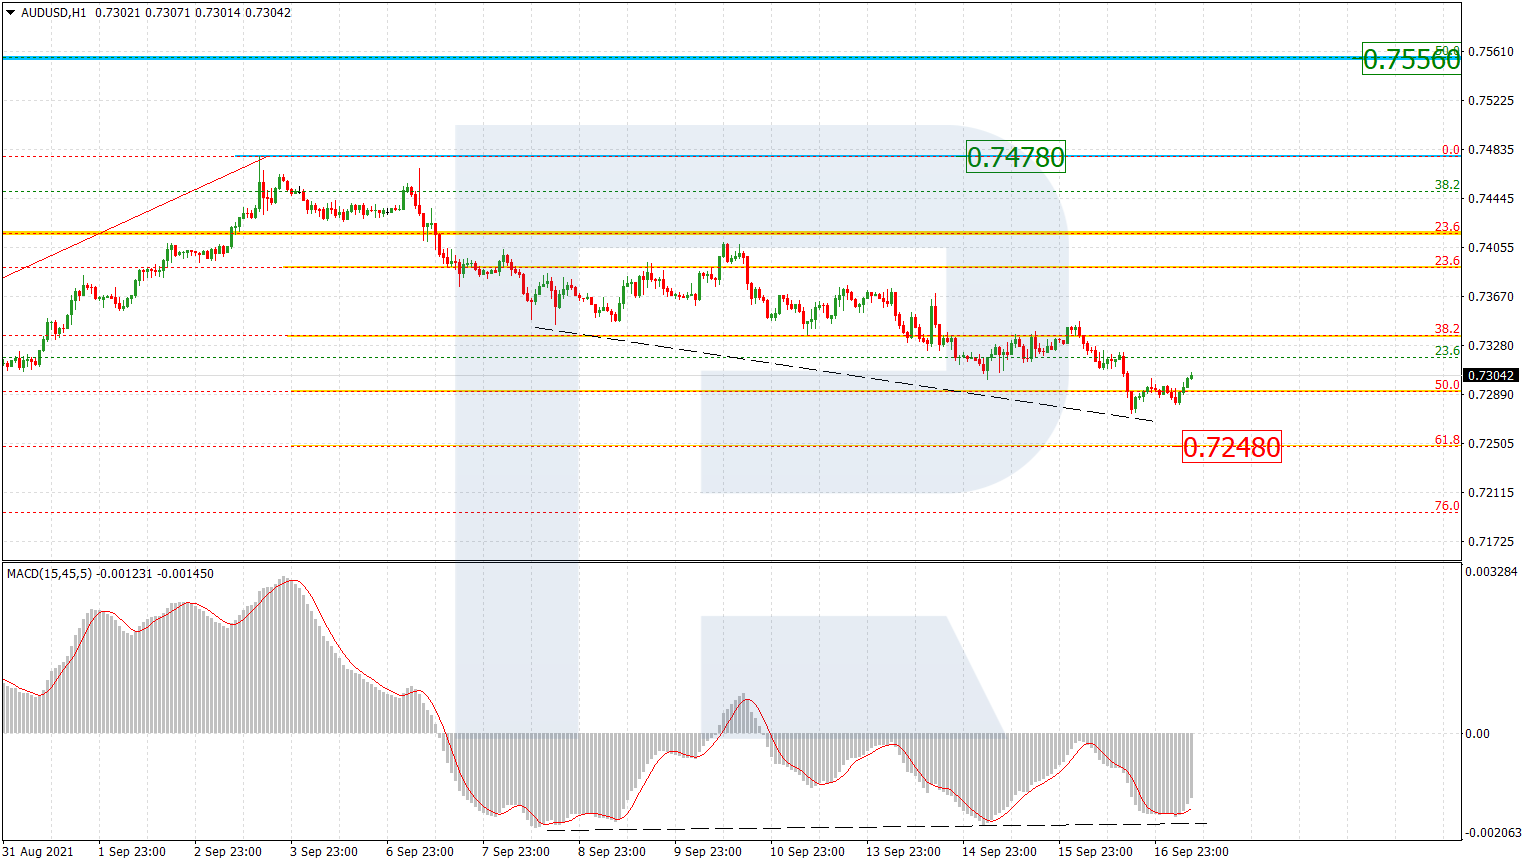
The H1 chart of AUDUSD shows convergence on MACD after the price reached 50.0% fibo. Possibly, there may be one more descending impulse towards 61.8% fibo but the overall technical picture implies that the correction is over. Later, the asset may resume growing towards the high at 0.7478.
Free Reports:
 Get our Weekly Commitment of Traders Reports - See where the biggest traders (Hedge Funds and Commercial Hedgers) are positioned in the futures markets on a weekly basis.
 Sign Up for Our Stock Market Newsletter – Get updated on News, Charts & Rankings of Public Companies when you join our Stocks Newsletter
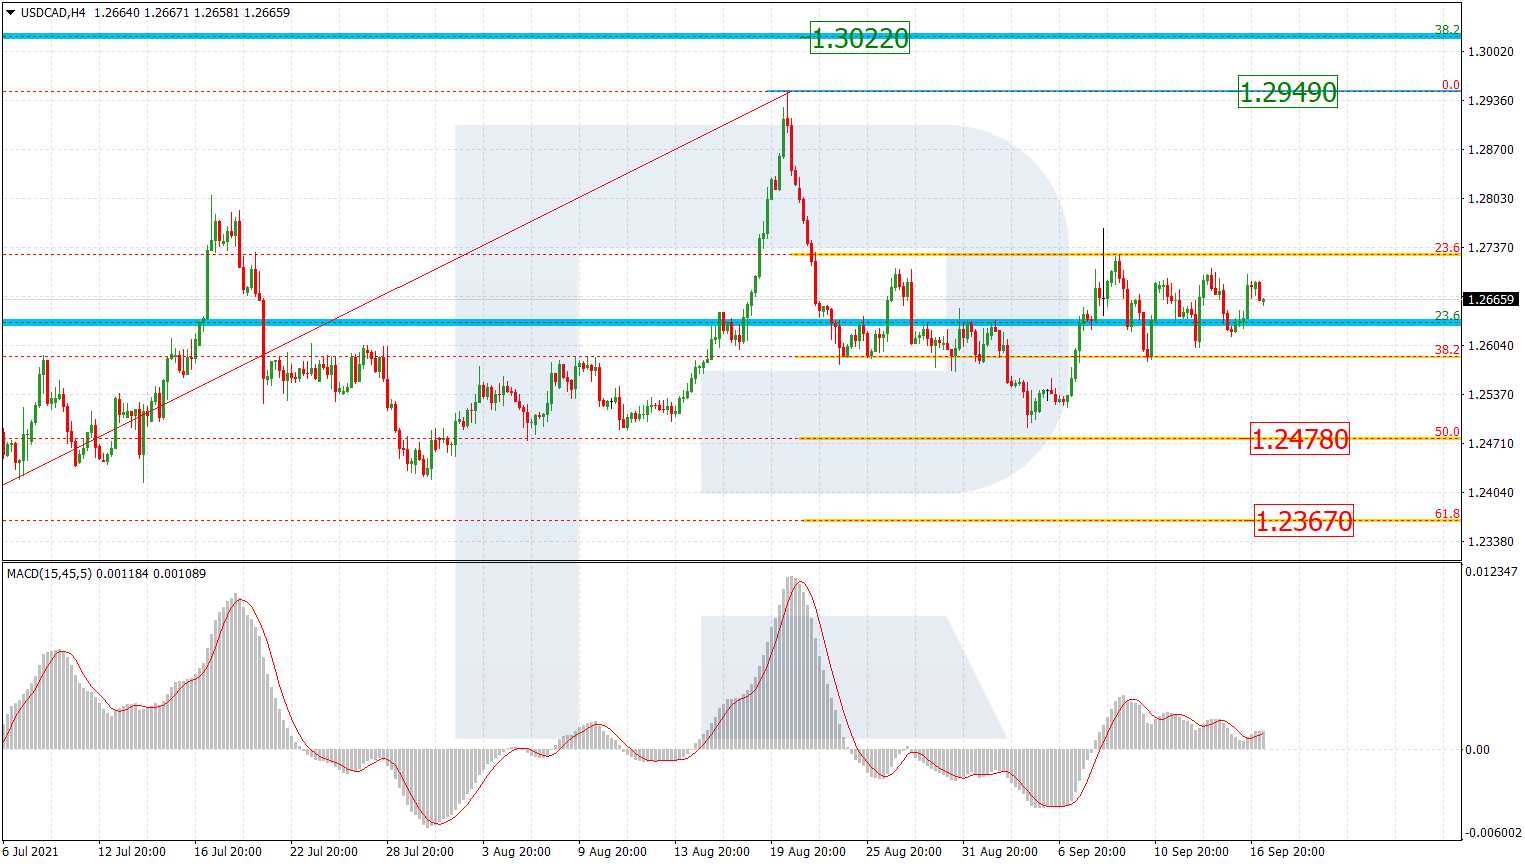
USDCAD, “US Dollar vs Canadian Dollar”
As we can see in the H4 chart, after an attempt to fall and reach 50.0% fibo at 1.2478, the pair completed a quick rising impulse, which was later followed by a consolidation range in the form of the Triangle pattern. This range should be considered as a correction relative to the previous rising impulse. Such a technical picture implies that the asset is currently trying to decide where to move next, down or up. A new wave to the downside may lead to 50.0% and 61.8% fibo at 1.2478 and 1.2367 respectively. On the other hand, one more rising wave may break the high at 1.2949 and then reach the long-term 38.2% fibo at 1.3022.
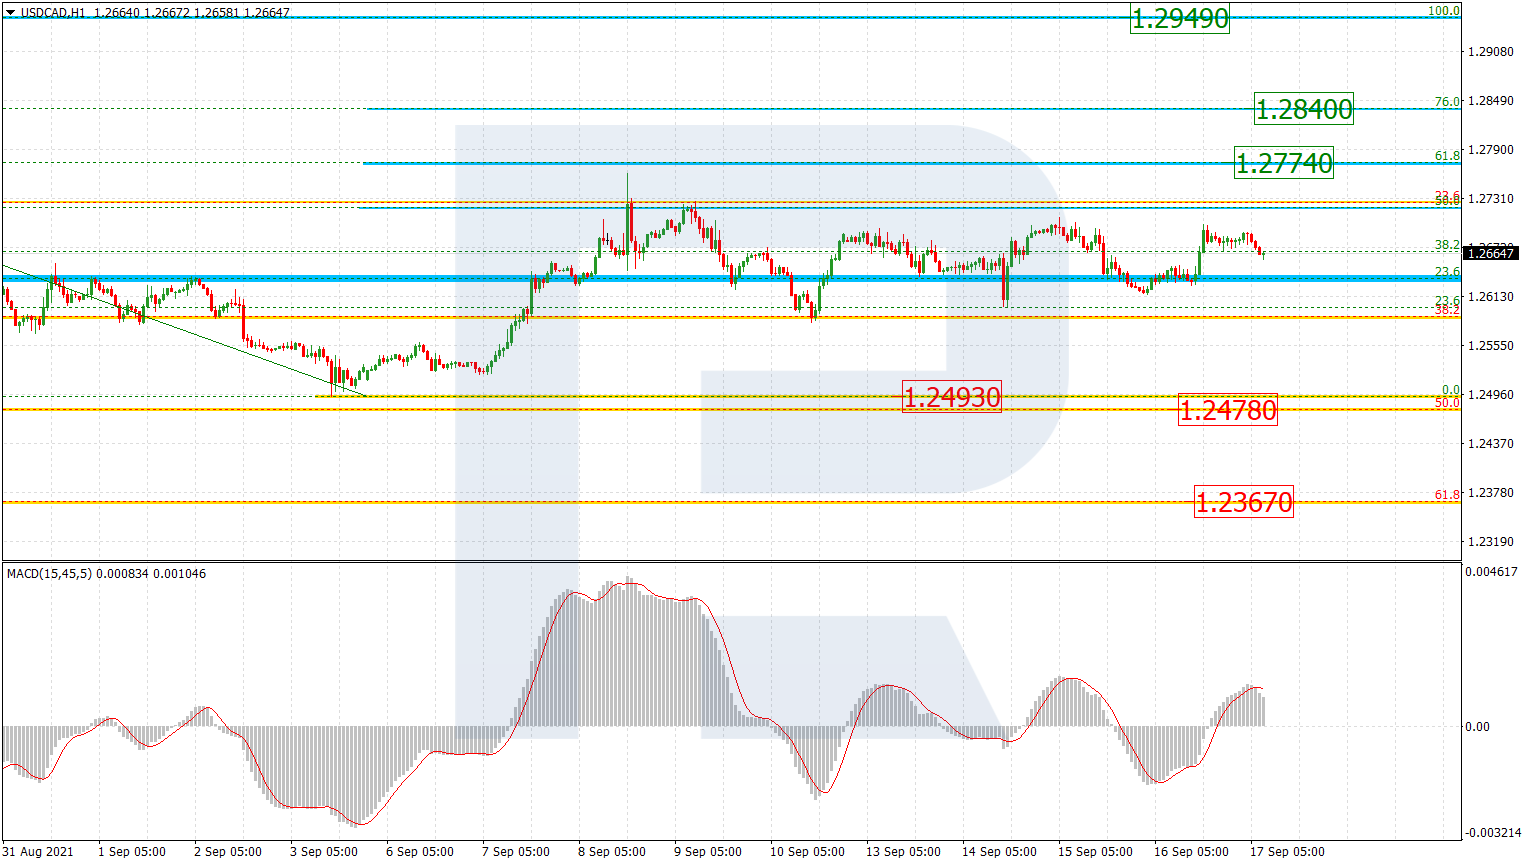
The H1 chart shows a more detailed structure of the current consolidation. Since this channel is a part of a rising impulse, the price may break it upwards and reach 61.8% and 76.0% fibo at 1.2774 and 1.2840 respectively. The support is the low at 1.2493.
Article By RoboForex.com
Attention!
Forecasts presented in this section only reflect the author’s private opinion and should not be considered as guidance for trading. RoboForex LP bears no responsibility for trading results based on trading recommendations described in these analytical reviews.

- COT Metals Charts: Speculator Bets led by Silver, Gold & Platinum Mar 7, 2026
- COT Bonds Charts: Speculator Bets led by 10-Year Bonds & Fed Funds Mar 7, 2026
- COT Energy Charts: Speculator Bets led by Brent Oil & Heating Oil Mar 7, 2026
- COT Soft Commodities Charts: Speculator Bets led by Corn & Soybean Meal Mar 7, 2026
- Investors run to safe-haven assets amid Middle East escalation Mar 6, 2026
- EUR/USD Under Pressure: Middle East Risks Outweigh All Else Mar 6, 2026
- Bitcoin shows resilience to Middle East events. Oil market stabilizes Mar 5, 2026
- GBP/USD: Market Not Expecting BoE Rate Cut in March Mar 5, 2026
- Brent headed for $100? Mar 4, 2026
- Global stock indices continue sell-off due to Middle East conflict Mar 4, 2026