
By Orbex

The structure of the AUDUSD pair suggests the construction of a triple zigzag consisting of cycle sub-waves w-x-y-x-z.
On the chart, we can see the end of the actionary wave y. After this, the market formed a bearish intervening wave x. It is likely that this wave has ended, as it represents a double zigzag of the primary degree.
We are currently in the initial part of the final actionary wave z. It will most likely take the form of a double combination, as shown on the chart.
In the short term, we expect the construction of a double zigzag Ⓦ-Ⓧ-Ⓨ near 0.787. At that level, wave z will be at 76.4% of wave y.
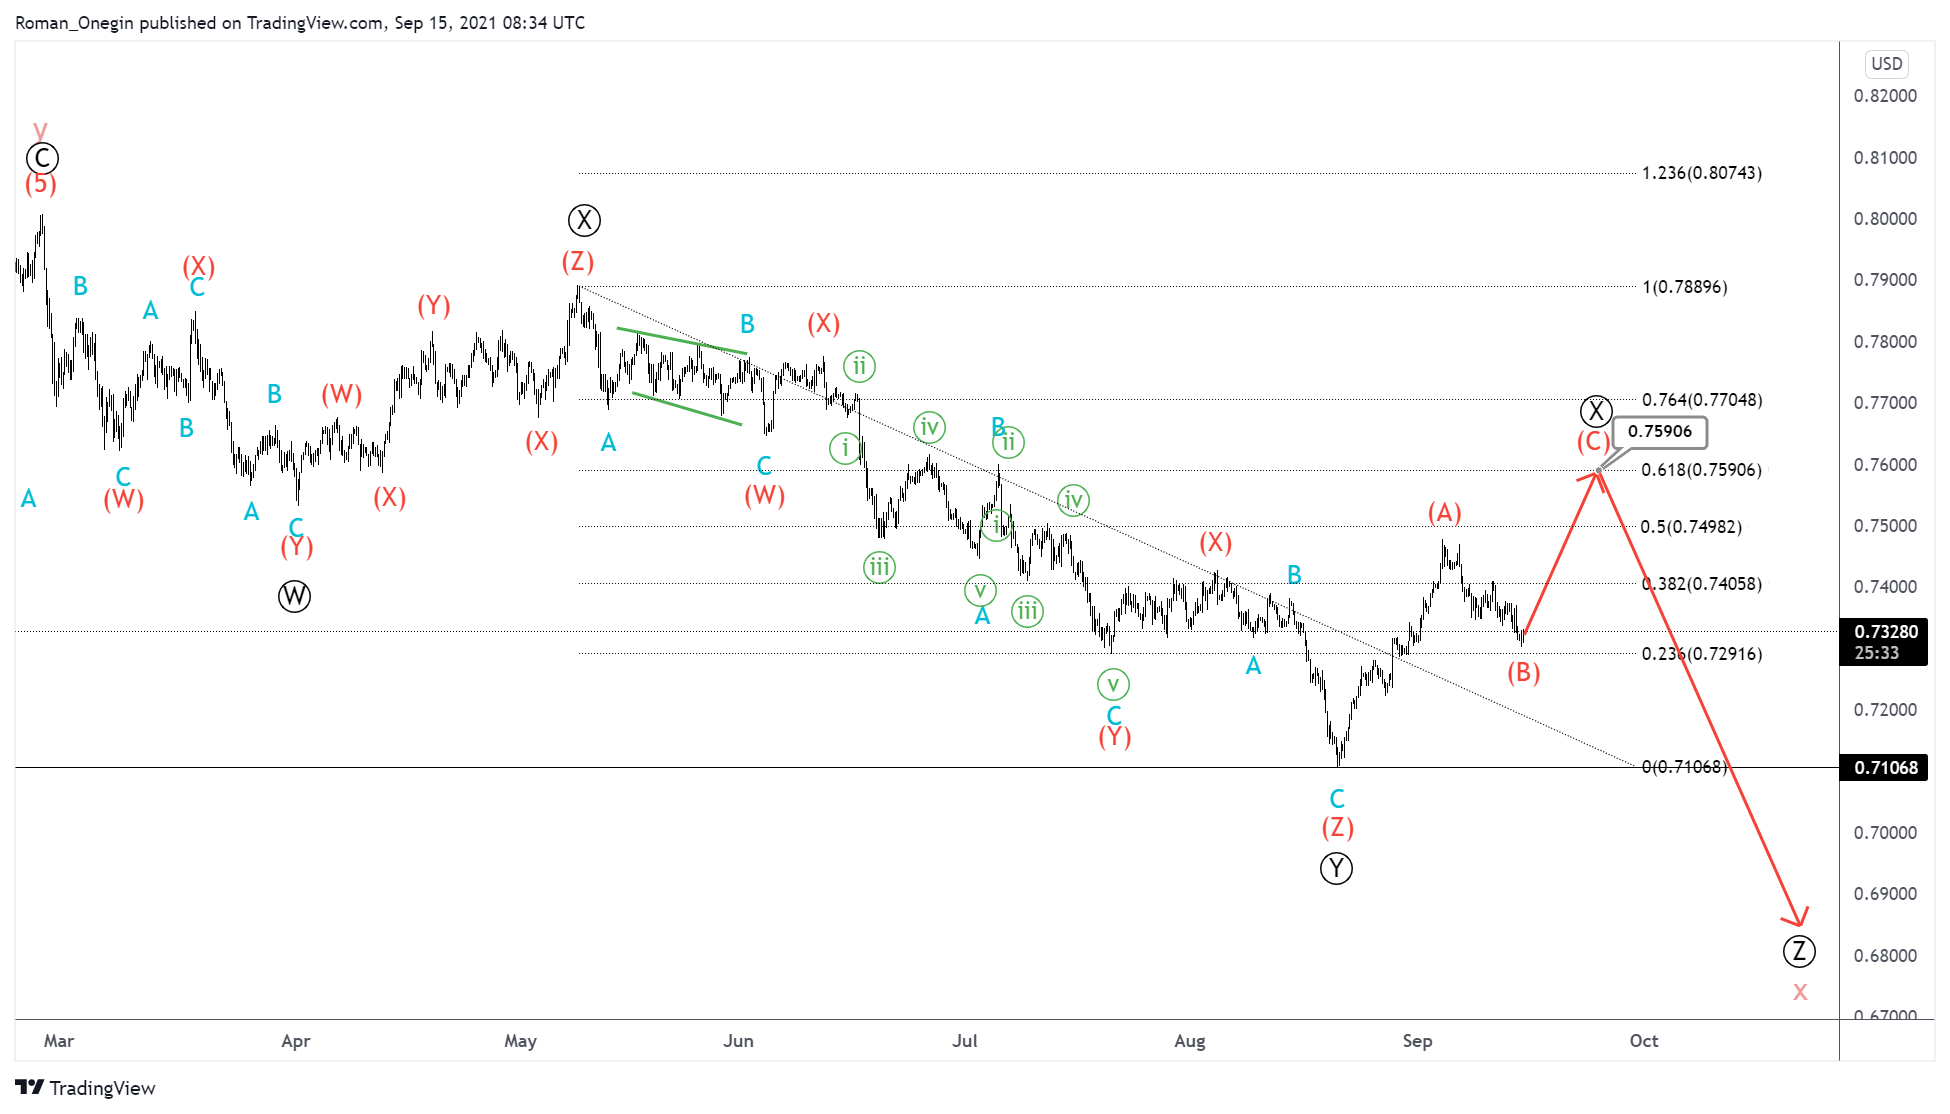
It is worth considering an alternative scenario, in which the formation of the cycle intervening wave x is not complete yet.
We can assume that it takes the form of a triple zigzag Ⓦ-Ⓧ-Ⓨ-Ⓧ-Ⓩ. Perhaps soon we will see the end of the primary intervening wave Ⓧ near the level of 0.759, where it will be at 61.8% of wave Ⓨ.
Then the primary wave Ⓩ may send the price down significantly below the maximum of 0.710.
![]() Article by Orbex
Article by Orbex
Orbex is a fully licensed broker that was established in 2011. Founded with a mission to serve its traders responsibly and provides traders with access to the world’s largest and most liquid financial markets. www.orbex.com