By Ino.com
– This week we have a stock market forecast for the week of 8/15/21 from our friend Bo Yoder of the Market Forecasting Academy. Be sure to leave a comment and let us know what you think!
Another week of drifting from the markets without any real increase in bullish or bearish pressures.
There are, of course, outliers that have moved, but they have been primarily low odds scenarios.
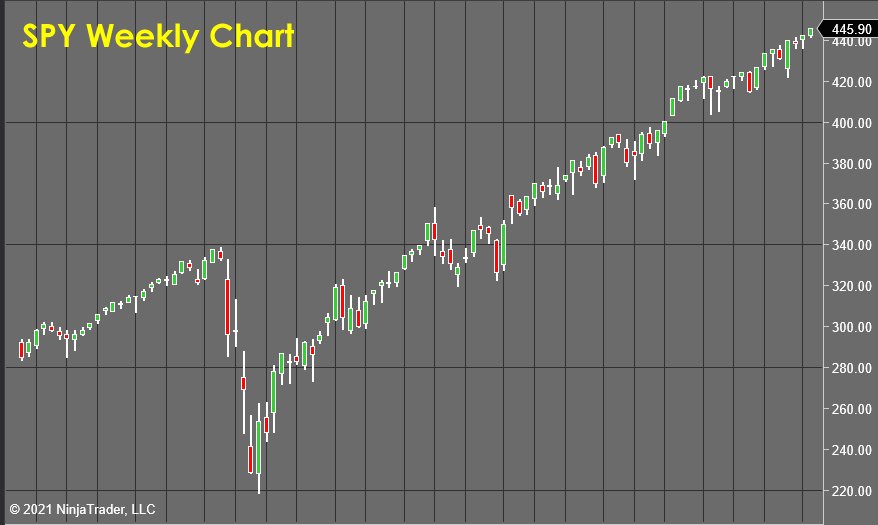
The S&P 500 (SPY)

The market keeps drifting higher without much passion in either direction. While it’s seductive to want to “jump on the train,” the odds at this point are poor. All it takes is one little geopolitical catalyst, and a market this overbought can snap back 5% in a matter of days.
Free Reports:
 Sign Up for Our Stock Market Newsletter – Get updated on News, Charts & Rankings of Public Companies when you join our Stocks Newsletter
 Get our Weekly Commitment of Traders Reports - See where the biggest traders (Hedge Funds and Commercial Hedgers) are positioned in the futures markets on a weekly basis.
This week, I’m hedging this market’s behavior with a short in the banking sector and re-entry to the long side in gold. This should give me some productive exposure, with the best possible chance to profit or at least break even if all hell breaks loose next week.
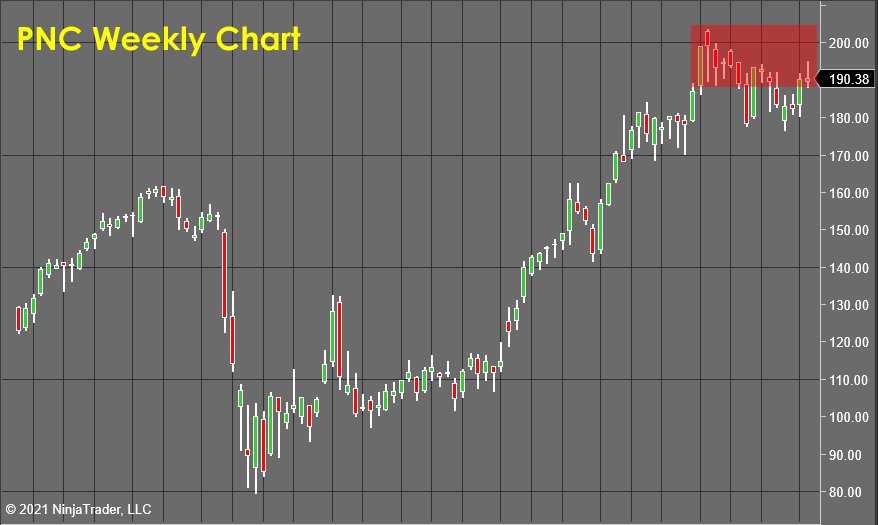
The PNC Financial Services Group, Inc. (PNC)

I see a lot of bearish action in the financials as traders and investors begin to discount the overbought market conditions and take profits out of the financial sector. However, PNC has rallied significantly off its lows around $80 per share, topping out near the $200 per share level.
Over the past few months, it has formed a complex correction, and this by signal has attracted the bull’s interest. Price rallied up and this week broke out above resistance near $190 per share. However, this breakout was rejected, completing a head and shoulders pattern on the weekly chart. This price action is confirmed by a sharp increase in bearish sentiment in my proprietary market forecasting toolset.
This puts us in a position to take some short exposure in this talk in anticipation of at least a multi-week correction.
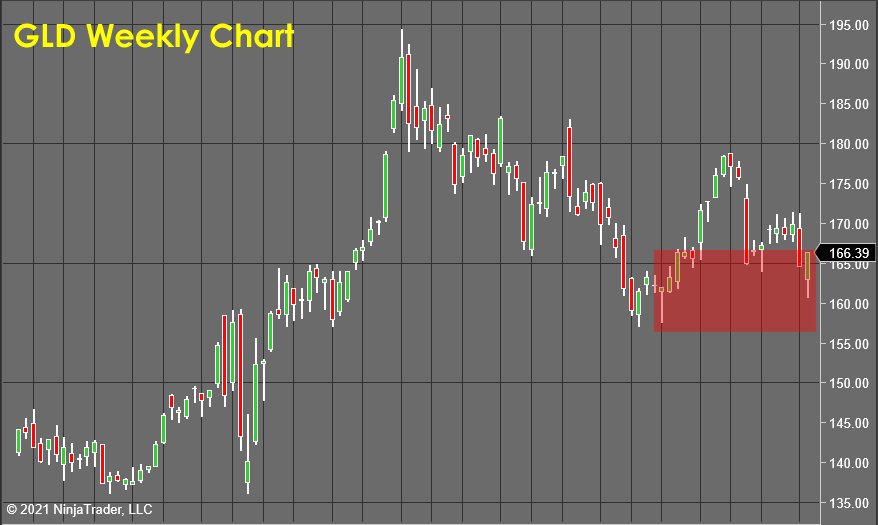
SPDR Gold Shares (GLD)

After capturing a nice bullish move in gold earlier this year, I have been stalking this market for a re-entry. This week the price of gold broke down below support near $165 per share and had quickly and violently rebounded.
This proves the support level and also completes an inverse head and shoulders pattern on the weekly chart. This price action, coupled with the proprietary supply and demand measurements that drive these forecasts, is telling me that the odds are high for gold to bottom out and begin a new rally at least up to challenge the $180 per share level.
This may be a longer-term hold, as the “second mouse gets the cheese” oftentimes as a market digests a significant reversal. But, as always, when resistances begin to get challenged, I’ll have to take a series of measurements, and that information will give me a lot more clarity about whether it is prudent to take profits or continue to hold gold in anticipation of a more significant breakout.
This Week’s Lesson: The History Of Edge Or Advantage Analysis
The human is an animal hardwired for aggressive risk-taking. When not risking personal safety in a dangerous world, our ancient ancestors also invented games of chance. There is evidence that gambling games were played more than 4,000 years ago in the ancient civilizations of China, Egypt, and Rome.
These ancient games of chance were often played with a square bone taken from the ankles of sheep or deer. Eventually, manufactured dice began to appear made out of ivory and stone. A set of ivory dice from approximately 1500 B.C. were found in Egypt, and by 900 B.C., the Etruscans had started to create dice with numbers laid out in a way that would look familiar to any Las Vegas stick man.
In ancient times, these games of chance were very much a part of the superstitious and religious experience of civilizations.
Probability theory and mathematics had yet to be developed, and so these ancient gamblers truly believed that the gods themselves controlled the outcome of every roll.
These days, just about any person on the planet would understand that the majority of these ancient games of chance were pure gambles, devoid of any statistical probability bias other than the physical imperfections of the dice themselves.
Since the rules of the games delivered a simple win or a loss, like flipping a coin, the outcome after a long night of gambling was determined by the mechanics of the game, not the mathematics of the payout structure. Therefore, our examination of edge begins not in ancient Egypt but in Pavia, Italy, in 1560.
Gerolamo Cardano was a mathematician, physician, astrologer, but most importantly, a gambler during the Italian Renaissance. A friend of Leonardo da Vinci, Cardano is perhaps best remembered for his algebraic achievements.
In the 1560s, he wrote a book called The Book on Games of Chance) but it was only published after his death in 1663.
Games of Chance is believed to be the first book on the systematic treatment of probability as related to games of chance. In this book, Cardano lays out the principles of dice probability that we all take for granted today.
By answering the question, “What are the odds that my next throw will be a 2?” mathematically, Cardano was the first to investigate the outcome of a dice roll as something other than the will of the gods.
This shift in thinking seems like a simple thing, yet it had profound effects.
Think of it from the perspective of a gambler in the seventeenth century. Once you understand that the gods don’t control the outcome of every roll, then you can begin to study and understand the possibility that the game’s results can be accurately predicted based on the rules of the gamble!
If the rules are biased toward one player, then that person can be said to experience a statistical advantage or “edge” over their opponent.
This brings us to the following definitions and their principles:
A “fair game,” such as a 50/50 coin toss for stakes of $1 a throw, offers no statistical advantage to either player.
In the short-term, one player may experience a short-term statistical anomaly that delivers a “lucky win streak,” but over time, the two gambling coin tossers will end up right back where they started.
The odds that one particular player will win the next toss is 50%.
The odds that the flip will produce a loss is also 50%.
An “advantaged game,” however, offers a statistical advantage or edge to one player.
This advantage may be overt (if the die rolls 1,2,3, or 4, I win, 5, or 6 you win), or mathematically based (I flip heads I win $2, if I flip tails, I lose $1).
As an example of this principle, consider the following advantage game…
You challenge an opponent to roll one die and correctly predict its outcome.
You offer to pay this opponent $4 for every $1 that is bet if they roll the number they predicted.
Even though the large payout of this wager seems attractive on the surface, the rules of this game are strongly biased in your favor.
The longer you play the game according to these rules, the larger your expected profit.
Since the outcome is being determined by a mechanical probability system (a six-sided die), the exact advantage or edge can be calculated by thinking through all the possible outcomes of the game in a logical manner.
Let’s go through the math on this, and then I will assign you a homework assignment. It’s REALLY IMPORTANT that you actually DO THESE EXERCISES!
Trading is such a “doing skill”; you just can’t read theory and nod your head and expect to be comfortable executing the skills in real-time when there is real money in the line…
We know that the die has six sides, and therefore has a one in six chance of matching any particular numerical prediction on the following roll.
According to the rules of the game, one of the six sides will be the number your opponent predicted and will result in a $4 loss.
The probability that this will occur on any given roll is 16.66%. (1/6)
However, five of the six sides will cause your opponent to lose the bet and will generate a $1 profit.
The probability that this will occur on any given roll is 83.33%. (5/6)
If the game is played, but once, there is a 16.66% chance that you could lose $4.
However, the longer you play, the closer the results will come to the statistical probabilities.
At the end of 100 rolls, you would expect to have won the $1 wager 83 times (83%) for a total profit of $83.
Your opponent can be expected to have won $4 from you 17 times out of the hundred rolls, delivering a loss of $68.
Subtract these losses from your gains, and you would have a net profit of $15.
This $15 profit is the result of your edge in this particular wager. I call this edge your “Expected Value” or “EV” for short.
Expressed as a percentage, this particular game should deliver a 15% profit on every dollar wagered in profits to the advantaged player.
If your opponent regularly wagers $1, then your statistically expressed profit expectation would be 15 cents every time a die is rolled.
If a new opponent hears about your game and wishes to participate by wagering $100 on every roll, then your statistical profit expectation would be $15 every time the die is rolled!
(Are you understanding now why Vegas tries so hard to bring in the high rollers?)
Seeing the earning potential this edge offers you, you invite 10 players to your house the following evening.
Everyone arrives as planned and begins the evening wagering $20 on every roll.
This means $200 is wagered each time the die is cast.
With a 15% advantage, this level of wagering will put $30 per roll in your pocket over time.
If the die is rolled 100 times per hour, then your game should generate revenue of approximately $3,000 per hour!
Do you understand now how the casino industry can afford to spend a BILLION DOLLARS building a casino to try and attract your action?
Your homework assignment for this lesson is to calculate the edge manually (NO PEEKING AT WEBSITES) for a traditional gambling game…
HOMEWORK ASSIGNMENT
The American roulette table has 38 slots, 18 of which are red.
Wagering $100 on red at a Vegas roulette table will pay out $100 if the ball falls into a red slot and will cost you $100 if the ball falls into one of the 18 black slots, or either of the two green “zero” slots.
What are the odds you will win if you go to Vegas and put $100 “on the red” at a roulette table?
What is the casino’s “EV” on this wager?
How much “margin” or edge expressed in dollars and cents does the casino have as an expectation every time you bet $100 on red?
To Learn How To Accurately and Consistently Forecast Market Prices Just Like Me, Using Market Vulnerability Analysis™, visit Market Forecasting Academy for the Free 5 Day Market Forecasting Primer.
Check back to see my next post!
Bo Yoder
Market Forecasting Academy
About Bo Yoder:
Beginning his full-time trading career in 1997, Bo is a professional trader, partner at Market Forecasting Academy, developer of The Myalolipsis Technique, two-time author, and consultant to the financial industry on matters of market analysis and edge optimization.
Bo has been a featured speaker internationally for decades and has developed a reputation for trading live in front of an audience as a real-time example of what it is like to trade for a living.
In addition to his two books for McGraw-Hill, Mastering Futures Trading and Optimize Your Trading Edge (translated into German and Japanese), Bo has written articles published in top publications such as TheStreet.com, Technical Analysis of Stocks & Commodities, Trader’s, Active Trader Magazine and Forbes to name a few.
Bo currently spends his time with his wife and son in the great state of Maine, where he trades, researches behavioral economics & neuropsychology, and is an enthusiastic sailboat racer.
He has an MBA from The Boston University School of Management.
Disclosure: This article is the opinion of the contributor themselves. The above is a matter of opinion provided for general information purposes only and is not intended as investment advice. This contributor is not receiving compensation for their opinion.
By Ino.com – See our Trader Blog, INO TV Free & Market Analysis Alerts
Source: Weekly Stock Market Forecast

- The RBA may go for a rate cut in February. New Zealand dollar is falling amid recession in the economy and RBNZ’s dovish stance Dec 27, 2024
- Flashpoint Friday: Bitcoin and Yen traders brace for Dec. 27 volatility Dec 26, 2024
- Canadian dollar declines after weak GDP data. Qatar threatens EU to halt natural gas exports Dec 24, 2024
- Goldman Sachs has updated its economic projections for 2025. EU countries are looking for alternative sources of natural gas Dec 23, 2024
- COT Bonds Charts: Speculator Bets led by SOFR 3-Months & 10-Year Bonds Dec 21, 2024
- COT Metals Charts: Speculator Bets led lower by Gold, Copper & Palladium Dec 21, 2024
- COT Soft Commodities Charts: Speculator Bets led by Live Cattle, Lean Hogs & Coffee Dec 21, 2024
- COT Stock Market Charts: Speculator Bets led by S&P500 & Russell-2000 Dec 21, 2024
- Riksbank and Banxico cut interest rates by 0.25%. BoE, Norges Bank, and PBoC left rates unchanged Dec 20, 2024
- Brent Oil Under Pressure Again: USD and China in Focus Dec 20, 2024

