
By CountingPips.com COT Home | Data Tables | Data Downloads | Newsletter
Here are the latest charts and statistics for the Commitment of Traders (COT) data published by the Commodities Futures Trading Commission (CFTC).
The latest COT data is updated through Tuesday August 03 2021 and shows a quick view of how large traders (for-profit speculators and commercial entities) were positioned in the futures markets.
Gold Comex Futures:
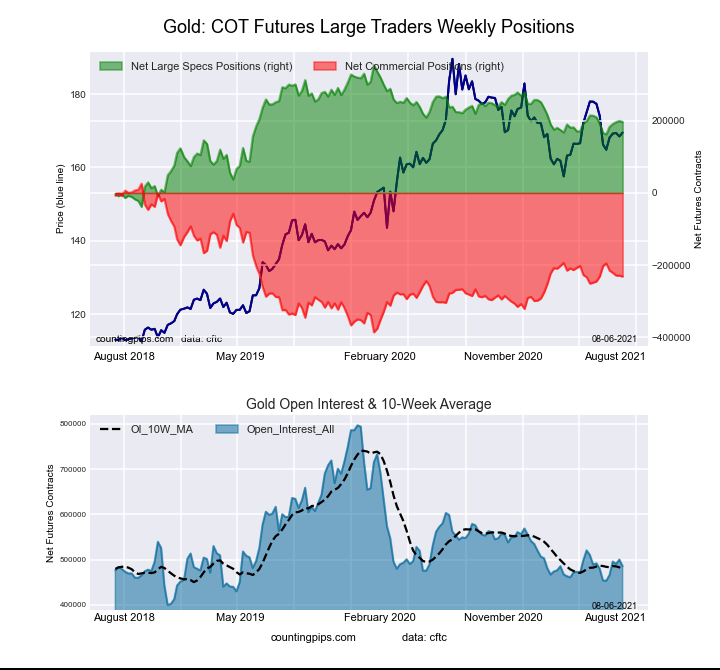 The Gold Comex Futures large speculator standing this week was a net position of 196,335 contracts in the data reported through Tuesday. This was a weekly decrease of -3,053 contracts from the previous week which had a total of 199,388 net contracts.
This week’s current strength score (the trader positioning range over the past three years, measured from 0 to 100) shows the speculators are currently Bullish with a score of 59.9 percent. The commercials are Bearish with a score of 37.5 percent and the small traders (not shown in chart) are Bullish with a score of 68.5 percent.
| Gold Futures Statistics | SPECULATORS | COMMERCIALS | SMALL TRADERS |
| – Percent of Open Interest Longs: | 56.2 | 25.0 | 10.6 |
| – Percent of Open Interest Shorts: | 15.8 | 72.6 | 3.4 |
| – Net Position: | 196,335 | -231,284 | 34,949 |
| – Gross Longs: | 273,143 | 121,349 | 51,591 |
| – Gross Shorts: | 76,808 | 352,633 | 16,642 |
| – Long to Short Ratio: | 3.6 to 1 | 0.3 to 1 | 3.1 to 1 |
| NET POSITION TREND: | |||
| – COT Index Score (3 Year Range Pct): | 59.9 | 37.5 | 68.5 |
| – COT Index Reading (3 Year Range): | Bullish | Bearish | Bullish |
| NET POSITION MOVEMENT INDEX: | |||
| – 6-Week Change in Strength Index: | 7.7 | -7.0 | -3.0 |
Free Reports:
 Get our Weekly Commitment of Traders Reports - See where the biggest traders (Hedge Funds and Commercial Hedgers) are positioned in the futures markets on a weekly basis.
 Sign Up for Our Stock Market Newsletter – Get updated on News, Charts & Rankings of Public Companies when you join our Stocks Newsletter
Silver Comex Futures:
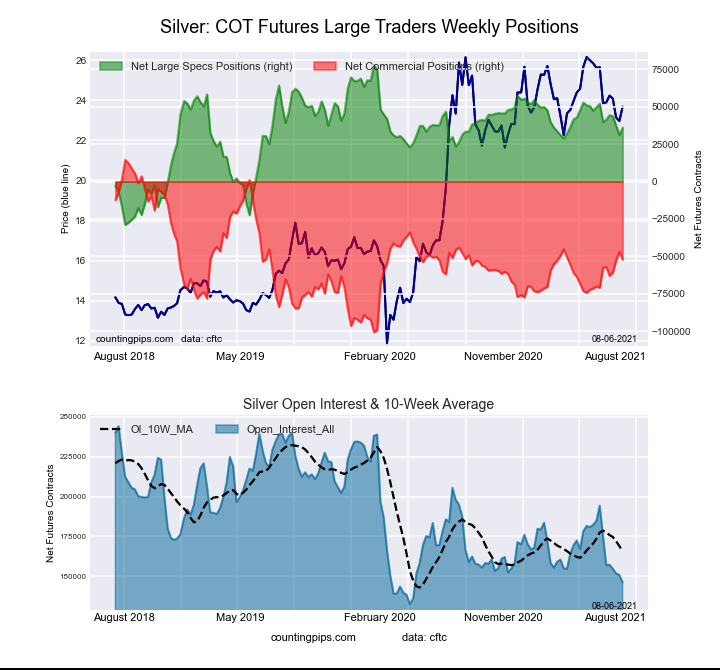 The Silver Comex Futures large speculator standing this week was a net position of 36,139 contracts in the data reported through Tuesday. This was a weekly rise of 4,922 contracts from the previous week which had a total of 31,217 net contracts.
This week’s current strength score (the trader positioning range over the past three years, measured from 0 to 100) shows the speculators are currently Bullish with a score of 60.9 percent. The commercials are Bearish with a score of 42.1 percent and the small traders (not shown in chart) are Bearish with a score of 33.9 percent.
| Silver Futures Statistics | SPECULATORS | COMMERCIALS | SMALL TRADERS |
| – Percent of Open Interest Longs: | 45.3 | 29.2 | 18.7 |
| – Percent of Open Interest Shorts: | 20.6 | 64.9 | 7.7 |
| – Net Position: | 36,139 | -52,169 | 16,030 |
| – Gross Longs: | 66,192 | 42,659 | 27,295 |
| – Gross Shorts: | 30,053 | 94,828 | 11,265 |
| – Long to Short Ratio: | 2.2 to 1 | 0.4 to 1 | 2.4 to 1 |
| NET POSITION TREND: | |||
| – COT Index Score (3 Year Range Pct): | 60.9 | 42.1 | 33.9 |
| – COT Index Reading (3 Year Range): | Bullish | Bearish | Bearish |
| NET POSITION MOVEMENT INDEX: | |||
| – 6-Week Change in Strength Index: | -3.5 | 4.8 | -10.8 |
Copper Grade #1 Futures:
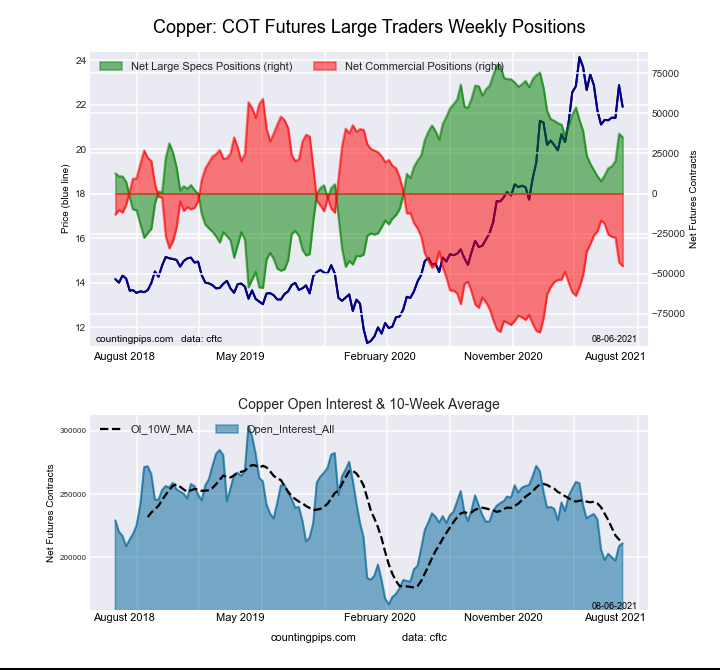 The Copper Grade #1 Futures large speculator standing this week was a net position of 35,060 contracts in the data reported through Tuesday. This was a weekly reduction of -2,291 contracts from the previous week which had a total of 37,351 net contracts.
This week’s current strength score (the trader positioning range over the past three years, measured from 0 to 100) shows the speculators are currently Bullish with a score of 67.6 percent. The commercials are Bearish with a score of 28.4 percent and the small traders (not shown in chart) are Bullish-Extreme with a score of 83.9 percent.
| Copper Futures Statistics | SPECULATORS | COMMERCIALS | SMALL TRADERS |
| – Percent of Open Interest Longs: | 43.6 | 36.9 | 10.0 |
| – Percent of Open Interest Shorts: | 27.0 | 58.3 | 5.2 |
| – Net Position: | 35,060 | -45,190 | 10,130 |
| – Gross Longs: | 91,973 | 77,829 | 21,046 |
| – Gross Shorts: | 56,913 | 123,019 | 10,916 |
| – Long to Short Ratio: | 1.6 to 1 | 0.6 to 1 | 1.9 to 1 |
| NET POSITION TREND: | |||
| – COT Index Score (3 Year Range Pct): | 67.6 | 28.4 | 83.9 |
| – COT Index Reading (3 Year Range): | Bullish | Bearish | Bullish-Extreme |
| NET POSITION MOVEMENT INDEX: | |||
| – 6-Week Change in Strength Index: | 19.7 | -19.6 | 6.3 |
Platinum Futures:
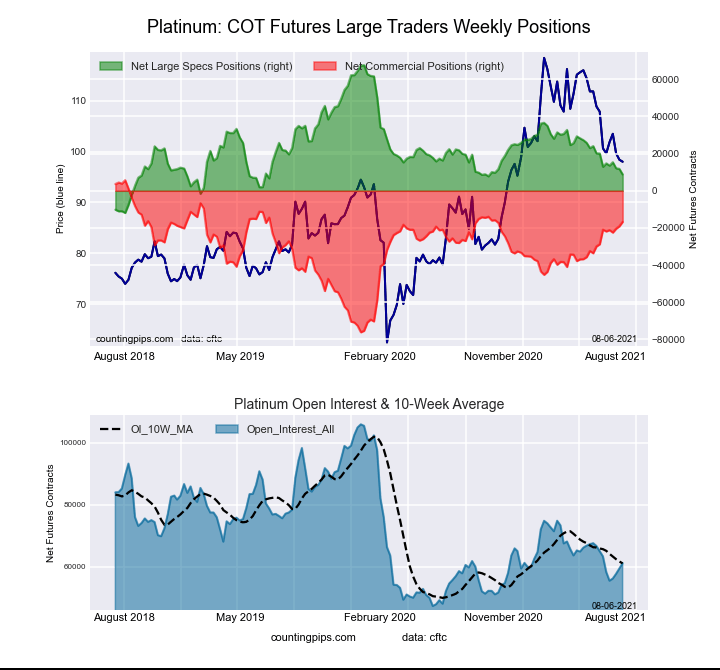 The Platinum Futures large speculator standing this week was a net position of 8,804 contracts in the data reported through Tuesday. This was a weekly decline of -2,991 contracts from the previous week which had a total of 11,795 net contracts.
This week’s current strength score (the trader positioning range over the past three years, measured from 0 to 100) shows the speculators are currently Bearish with a score of 26.1 percent. The commercials are Bullish with a score of 72.6 percent and the small traders (not shown in chart) are Bullish with a score of 72.7 percent.
| Platinum Futures Statistics | SPECULATORS | COMMERCIALS | SMALL TRADERS |
| – Percent of Open Interest Longs: | 50.3 | 30.2 | 17.7 |
| – Percent of Open Interest Shorts: | 35.9 | 57.6 | 4.7 |
| – Net Position: | 8,804 | -16,734 | 7,930 |
| – Gross Longs: | 30,735 | 18,428 | 10,808 |
| – Gross Shorts: | 21,931 | 35,162 | 2,878 |
| – Long to Short Ratio: | 1.4 to 1 | 0.5 to 1 | 3.8 to 1 |
| NET POSITION TREND: | |||
| – COT Index Score (3 Year Range Pct): | 26.1 | 72.6 | 72.7 |
| – COT Index Reading (3 Year Range): | Bearish | Bullish | Bullish |
| NET POSITION MOVEMENT INDEX: | |||
| – 6-Week Change in Strength Index: | -5.2 | 5.1 | -0.8 |
Palladium Futures:
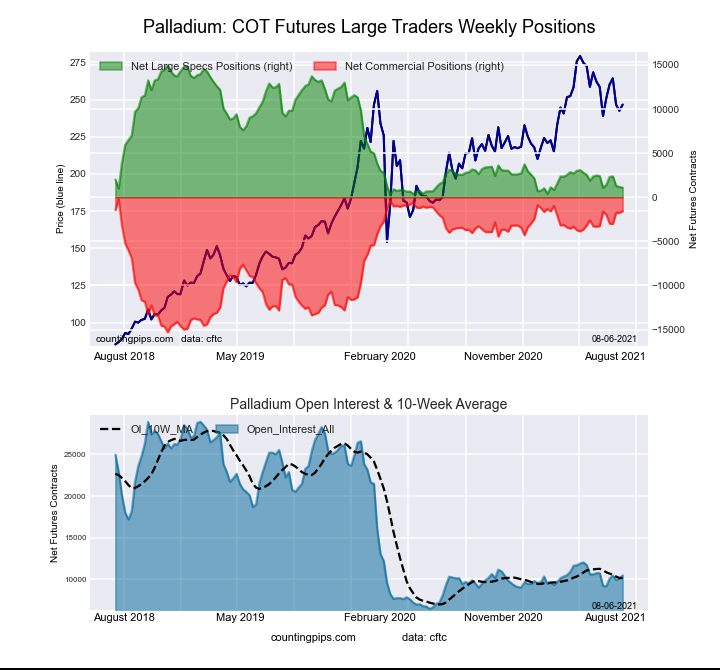 The Palladium Futures large speculator standing this week was a net position of 1,088 contracts in the data reported through Tuesday. This was a weekly lowering of -87 contracts from the previous week which had a total of 1,175 net contracts.
This week’s current strength score (the trader positioning range over the past three years, measured from 0 to 100) shows the speculators are currently Bearish-Extreme with a score of 5.4 percent. The commercials are Bullish-Extreme with a score of 91.0 percent and the small traders (not shown in chart) are Bullish with a score of 73.3 percent.
| Palladium Futures Statistics | SPECULATORS | COMMERCIALS | SMALL TRADERS |
| – Percent of Open Interest Longs: | 48.8 | 36.5 | 12.9 |
| – Percent of Open Interest Shorts: | 38.4 | 51.5 | 8.3 |
| – Net Position: | 1,088 | -1,571 | 483 |
| – Gross Longs: | 5,118 | 3,824 | 1,349 |
| – Gross Shorts: | 4,030 | 5,395 | 866 |
| – Long to Short Ratio: | 1.3 to 1 | 0.7 to 1 | 1.6 to 1 |
| NET POSITION TREND: | |||
| – COT Index Score (3 Year Range Pct): | 5.4 | 91.0 | 73.3 |
| – COT Index Reading (3 Year Range): | Bearish-Extreme | Bullish-Extreme | Bullish |
| NET POSITION MOVEMENT INDEX: | |||
| – 6-Week Change in Strength Index: | 0.1 | 0.4 | -4.1 |
Article By CountingPips.com – Receive our weekly COT Reports by Email
*COT Report: The COT data, released weekly to the public each Friday, is updated through the most recent Tuesday (data is 3 days old) and shows a quick view of how large speculators or non-commercials (for-profit traders) were positioned in the futures markets.
The CFTC categorizes trader positions according to commercial hedgers (traders who use futures contracts for hedging as part of the business), non-commercials (large traders who speculate to realize trading profits) and nonreportable traders (usually small traders/speculators).
Find CFTC criteria here: (http://www.cftc.gov/MarketReports/CommitmentsofTraders/ExplanatoryNotes/index.htm).

- COT Metals Charts: Speculator Bets led by Silver, Gold & Platinum Mar 7, 2026
- COT Bonds Charts: Speculator Bets led by 10-Year Bonds & Fed Funds Mar 7, 2026
- COT Energy Charts: Speculator Bets led by Brent Oil & Heating Oil Mar 7, 2026
- COT Soft Commodities Charts: Speculator Bets led by Corn & Soybean Meal Mar 7, 2026
- Investors run to safe-haven assets amid Middle East escalation Mar 6, 2026
- EUR/USD Under Pressure: Middle East Risks Outweigh All Else Mar 6, 2026
- Bitcoin shows resilience to Middle East events. Oil market stabilizes Mar 5, 2026
- GBP/USD: Market Not Expecting BoE Rate Cut in March Mar 5, 2026
- Brent headed for $100? Mar 4, 2026
- Global stock indices continue sell-off due to Middle East conflict Mar 4, 2026