
Article By RoboForex.com
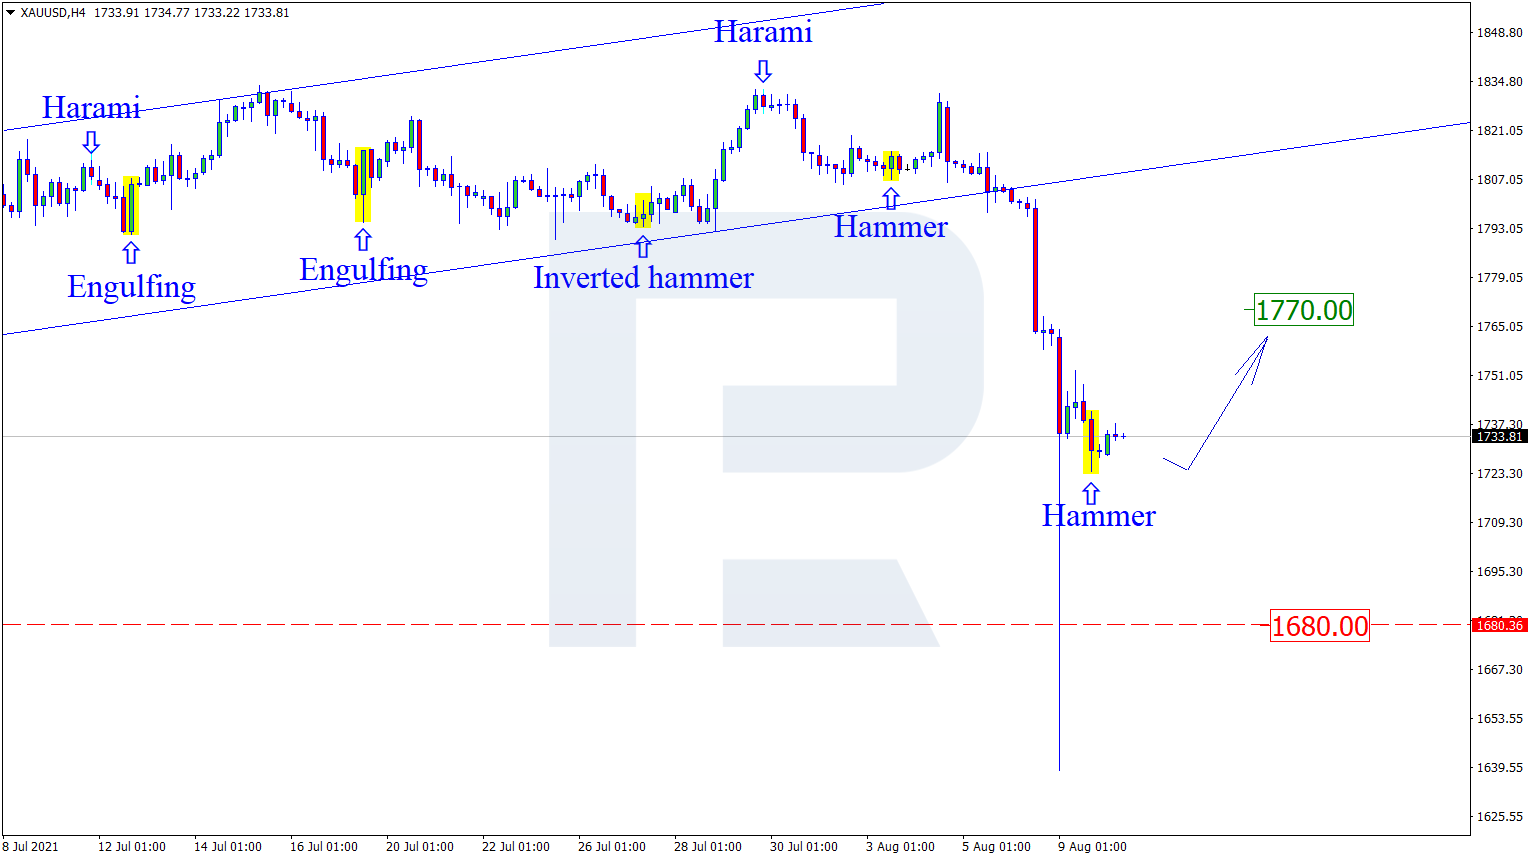
XAUUSD, “Gold vs US Dollar”
The pair keeps correcting. Having declined steeply, the quotations are recovering now. At the support level, the pair has formed several reversal candlestick patterns, including a Hammer and a Doji. Going by the patterns, the pair might start growing to the resistance level at 1770.00. However, the quotations might go on declining to 1680.00, skipping the reversal signals altogether.

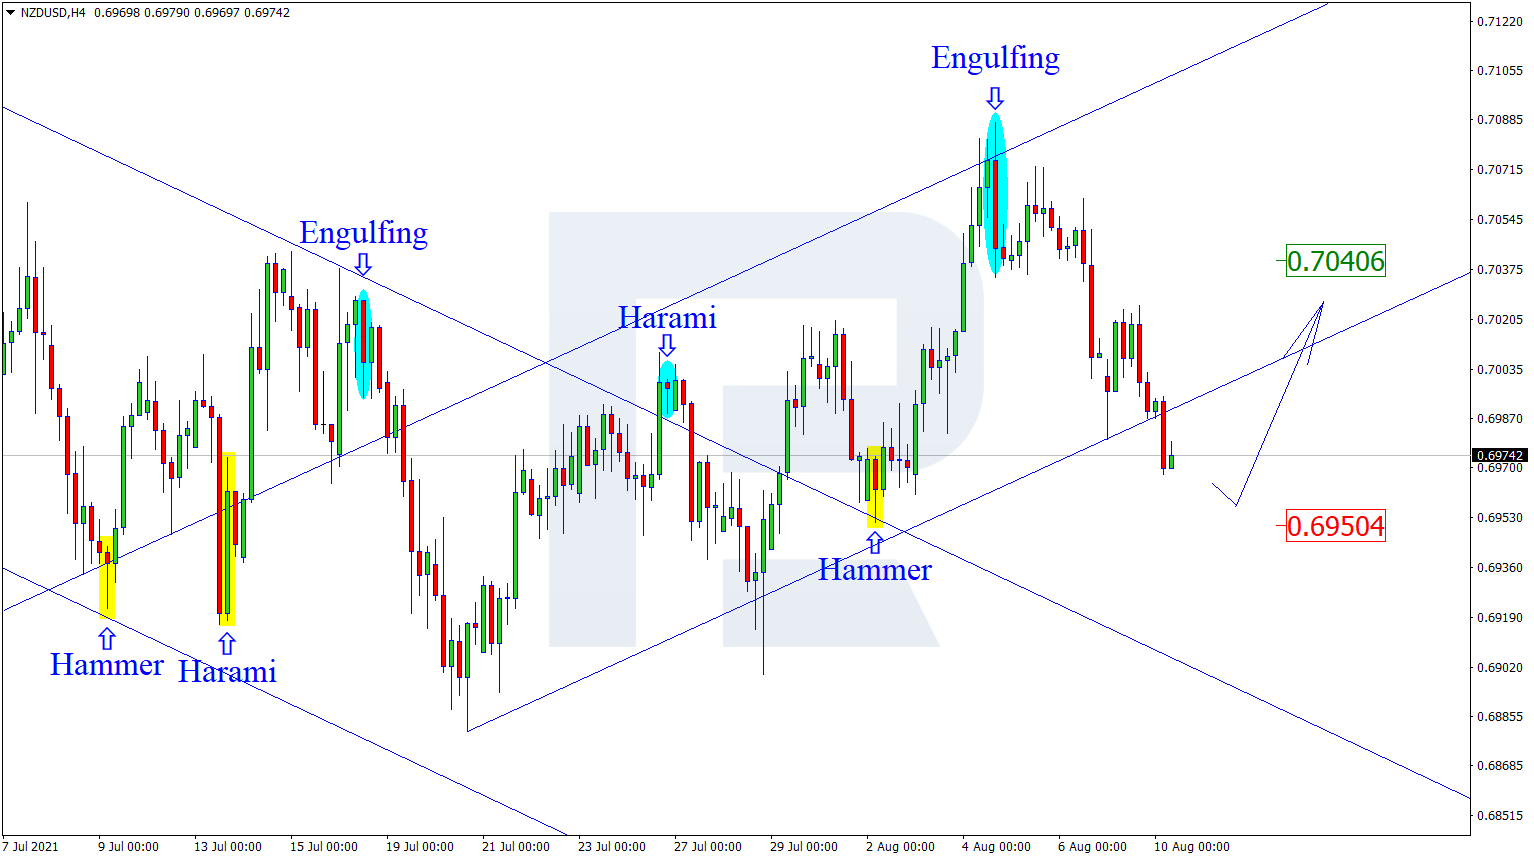
NZDUSD, “New Zealand Dollar vs US Dollar”
The pair tested the upper border of the channel and formed several reversal patterns, including an Engulfing. The pair now keeps going by the patterns, heading for the support level of 0.6950. Upon testing it, the price might bounce off it and continue the ascending dynamics. However, the quotations might start growing to 0.7040 without testing the support level.
Free Reports:
 Download Our Metatrader 4 Indicators – Put Our Free MetaTrader 4 Custom Indicators on your charts when you join our Weekly Newsletter
 Get our Weekly Commitment of Traders Reports - See where the biggest traders (Hedge Funds and Commercial Hedgers) are positioned in the futures markets on a weekly basis.
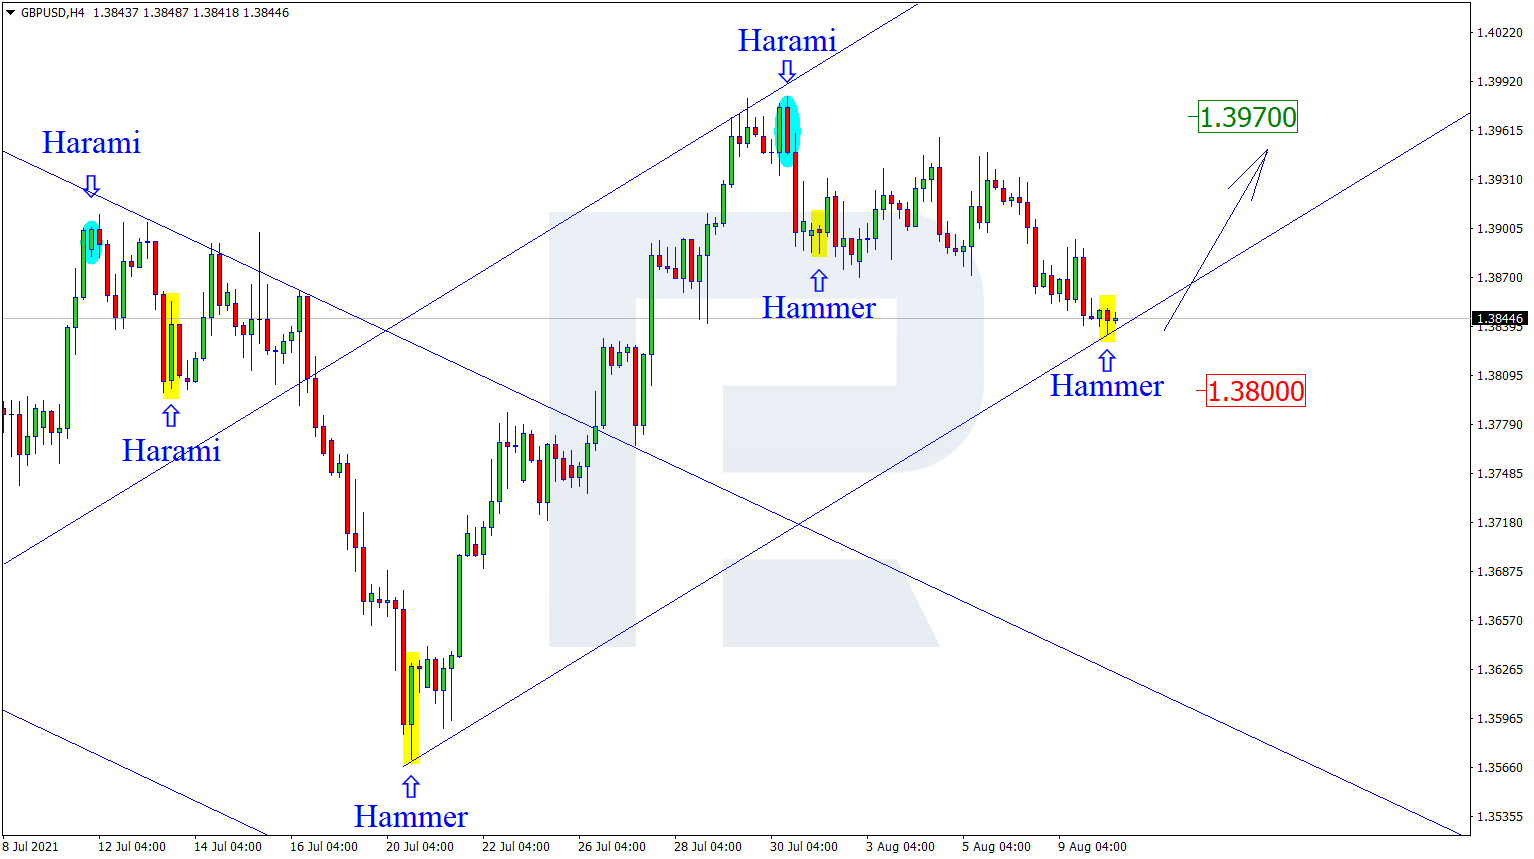
GBPUSD, “Great Britain Pound vs US Dollar”
On H4, the pair continues a correctional wave. At the support level, the pair has formed several reversal patterns, including a Hammer. Going by the patterns, the pair may currently start growing towards the next resistance level. The aim is 1.3970. Upon testing it, the pair might break through it and continue developing the uptrend. However, the quotations might still keep falling to the support level of 1.3800 before resuming growth.
Article By RoboForex.com
Attention!
Forecasts presented in this section only reflect the author’s private opinion and should not be considered as guidance for trading. RoboForex LP bears no responsibility for trading results based on trading recommendations described in these analytical reviews.

- COT Metals Charts: Speculator Bets led by Silver, Gold & Platinum Mar 7, 2026
- COT Bonds Charts: Speculator Bets led by 10-Year Bonds & Fed Funds Mar 7, 2026
- COT Energy Charts: Speculator Bets led by Brent Oil & Heating Oil Mar 7, 2026
- COT Soft Commodities Charts: Speculator Bets led by Corn & Soybean Meal Mar 7, 2026
- Investors run to safe-haven assets amid Middle East escalation Mar 6, 2026
- EUR/USD Under Pressure: Middle East Risks Outweigh All Else Mar 6, 2026
- Bitcoin shows resilience to Middle East events. Oil market stabilizes Mar 5, 2026
- GBP/USD: Market Not Expecting BoE Rate Cut in March Mar 5, 2026
- Brent headed for $100? Mar 4, 2026
- Global stock indices continue sell-off due to Middle East conflict Mar 4, 2026