
By Orbex
USDCHF retests Fibonacci level

The US dollar takes a backseat as traders await the Fed’s update at the Jackson Hole symposium tomorrow.
The pair is trading within a narrowing range between 0.9020 and 0.9240. This is a sign of momentary hesitation amid mixed data signals.
The greenback is testing again the 61.8% (0.9100) Fibonacci retracement level from the August rally.
A rebound will need to clear 0.9170 to attract more patient players. A bearish breakout towards 0.9020 on the other hand may invalidate the recent rally.
Free Reports:
 Get our Weekly Commitment of Traders Reports - See where the biggest traders (Hedge Funds and Commercial Hedgers) are positioned in the futures markets on a weekly basis.
 Download Our Metatrader 4 Indicators – Put Our Free MetaTrader 4 Custom Indicators on your charts when you join our Weekly Newsletter
CADJPY grinds resistance
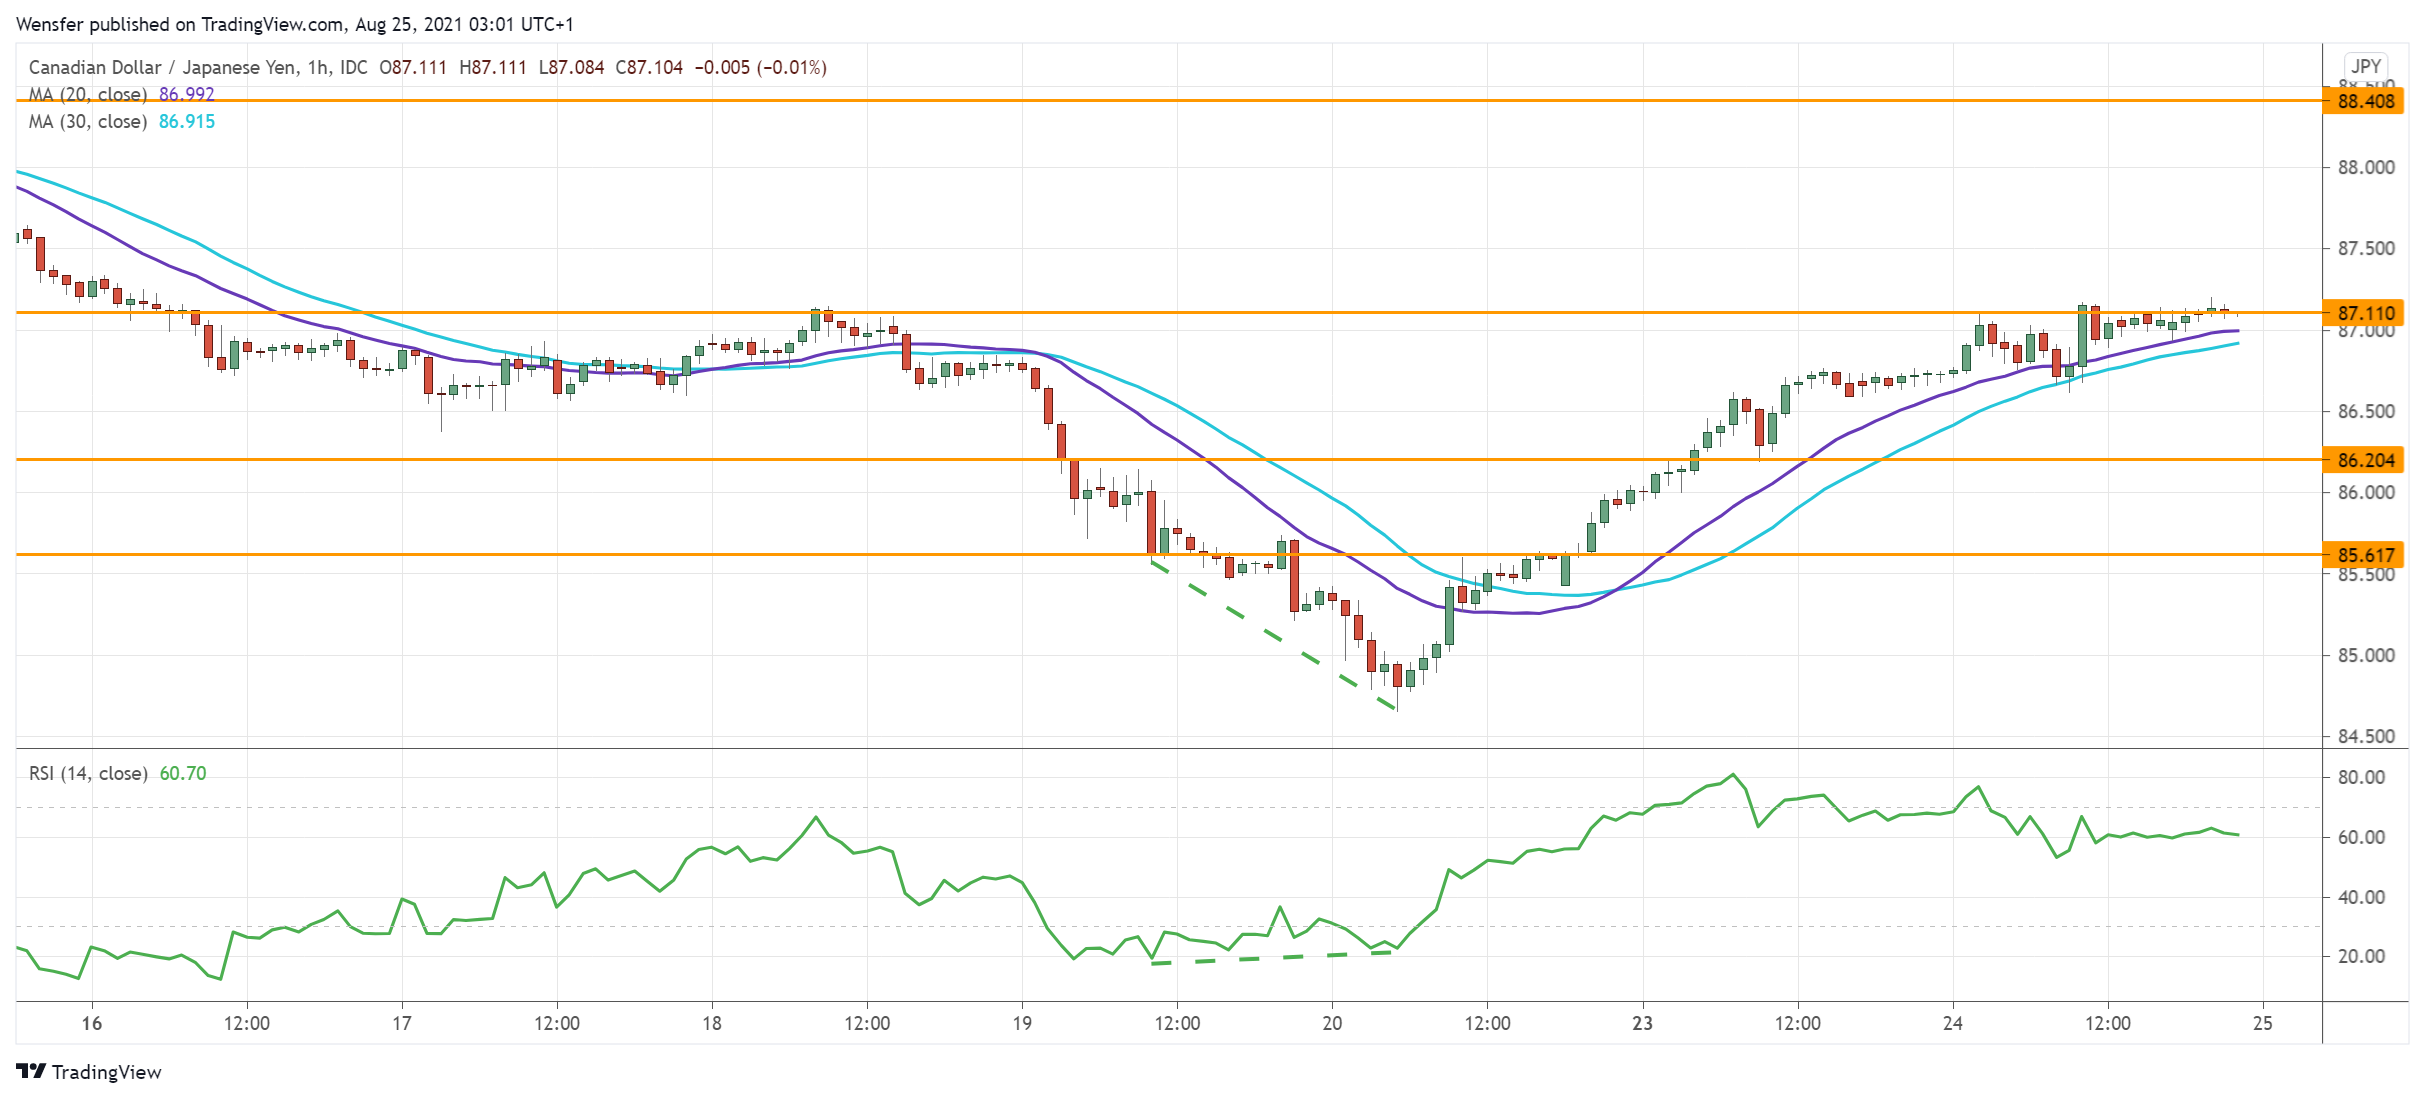
The Canadian dollar bounces back supported thanks to a recovery in oil price.
The break below the daily support at 85.50 suggests that sentiment may have turned downbeat in the medium-term. However, there is still room for an intraday rebound after the RSI’s double-dip into the oversold area.
The indicator’s divergence also showed a slowdown in the sell-off.
A close above 87.10 would lead to the supply zone at 88.40 where we can expect stronger selling pressure. 86.20 is fresh support on the downside.
NZDCHF bounces off key support
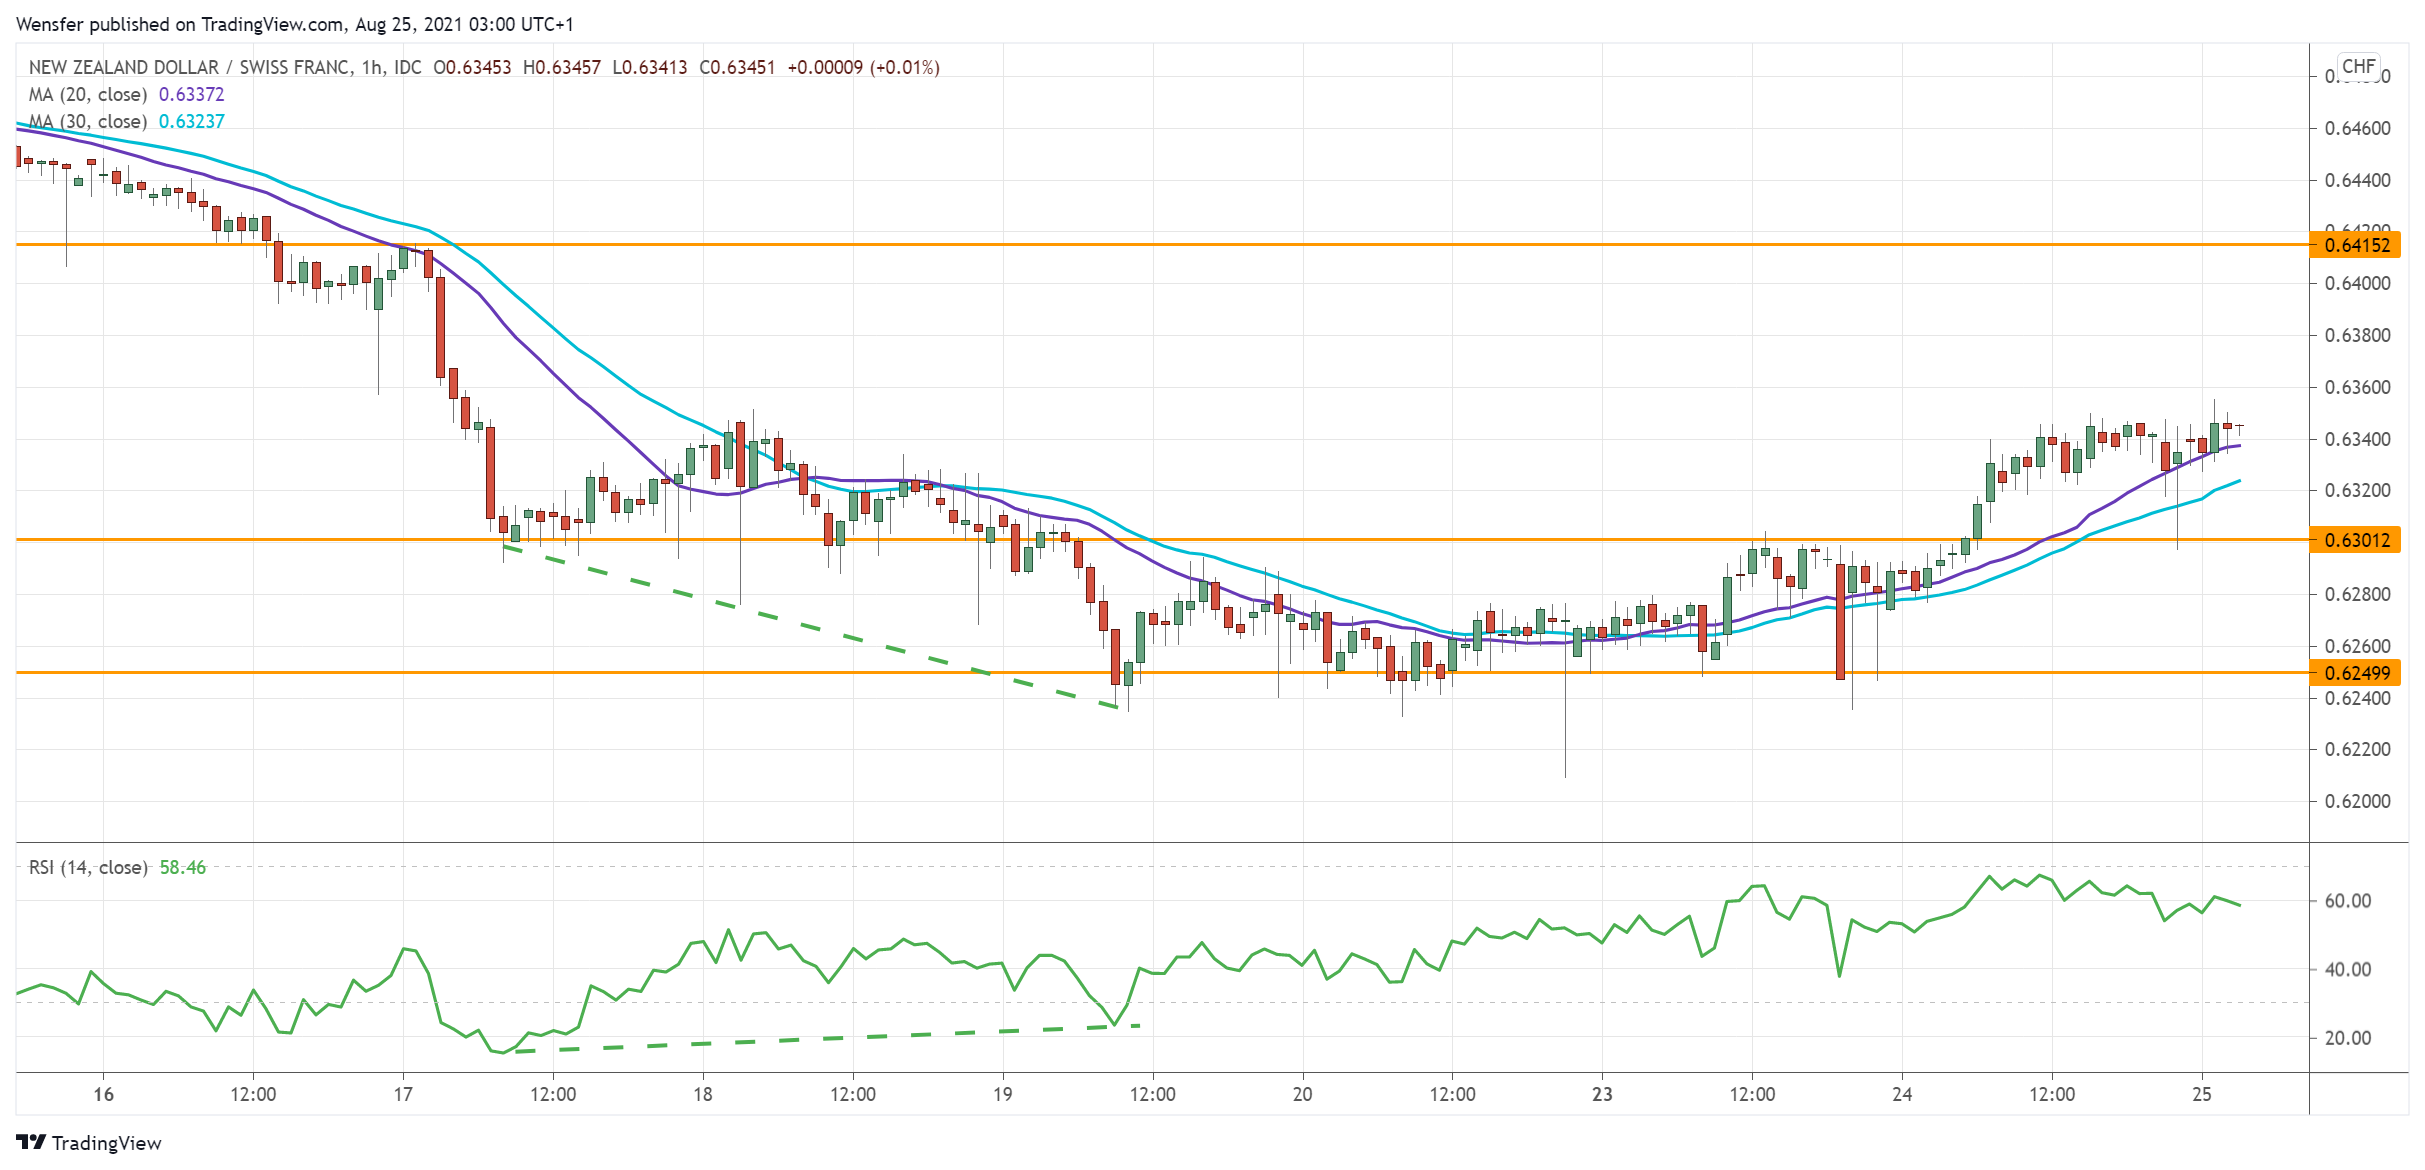
The New Zealand dollar climbed after the RBNZ’s chief economist said that the outbreak has limited effect on monetary policy.
The pair saw buying interest at December’s low at 0.6250. The RSI’s bullish divergence in this demand zone was an important signal that sellers had become less aggressive.
The subsequent rally above 0.6330 is a confirmation that a rebound is underway.
0.6415 would be an intermediate resistance. 0.6300 is fresh support in case of a pullback as the RSI inches towards an overbought situation.
By Orbex

- COT Metals Charts: Speculator Bets led by Silver, Gold & Platinum Mar 7, 2026
- COT Bonds Charts: Speculator Bets led by 10-Year Bonds & Fed Funds Mar 7, 2026
- COT Energy Charts: Speculator Bets led by Brent Oil & Heating Oil Mar 7, 2026
- COT Soft Commodities Charts: Speculator Bets led by Corn & Soybean Meal Mar 7, 2026
- Investors run to safe-haven assets amid Middle East escalation Mar 6, 2026
- EUR/USD Under Pressure: Middle East Risks Outweigh All Else Mar 6, 2026
- Bitcoin shows resilience to Middle East events. Oil market stabilizes Mar 5, 2026
- GBP/USD: Market Not Expecting BoE Rate Cut in March Mar 5, 2026
- Brent headed for $100? Mar 4, 2026
- Global stock indices continue sell-off due to Middle East conflict Mar 4, 2026