
By Orbex
XAUUSD tests key resistance
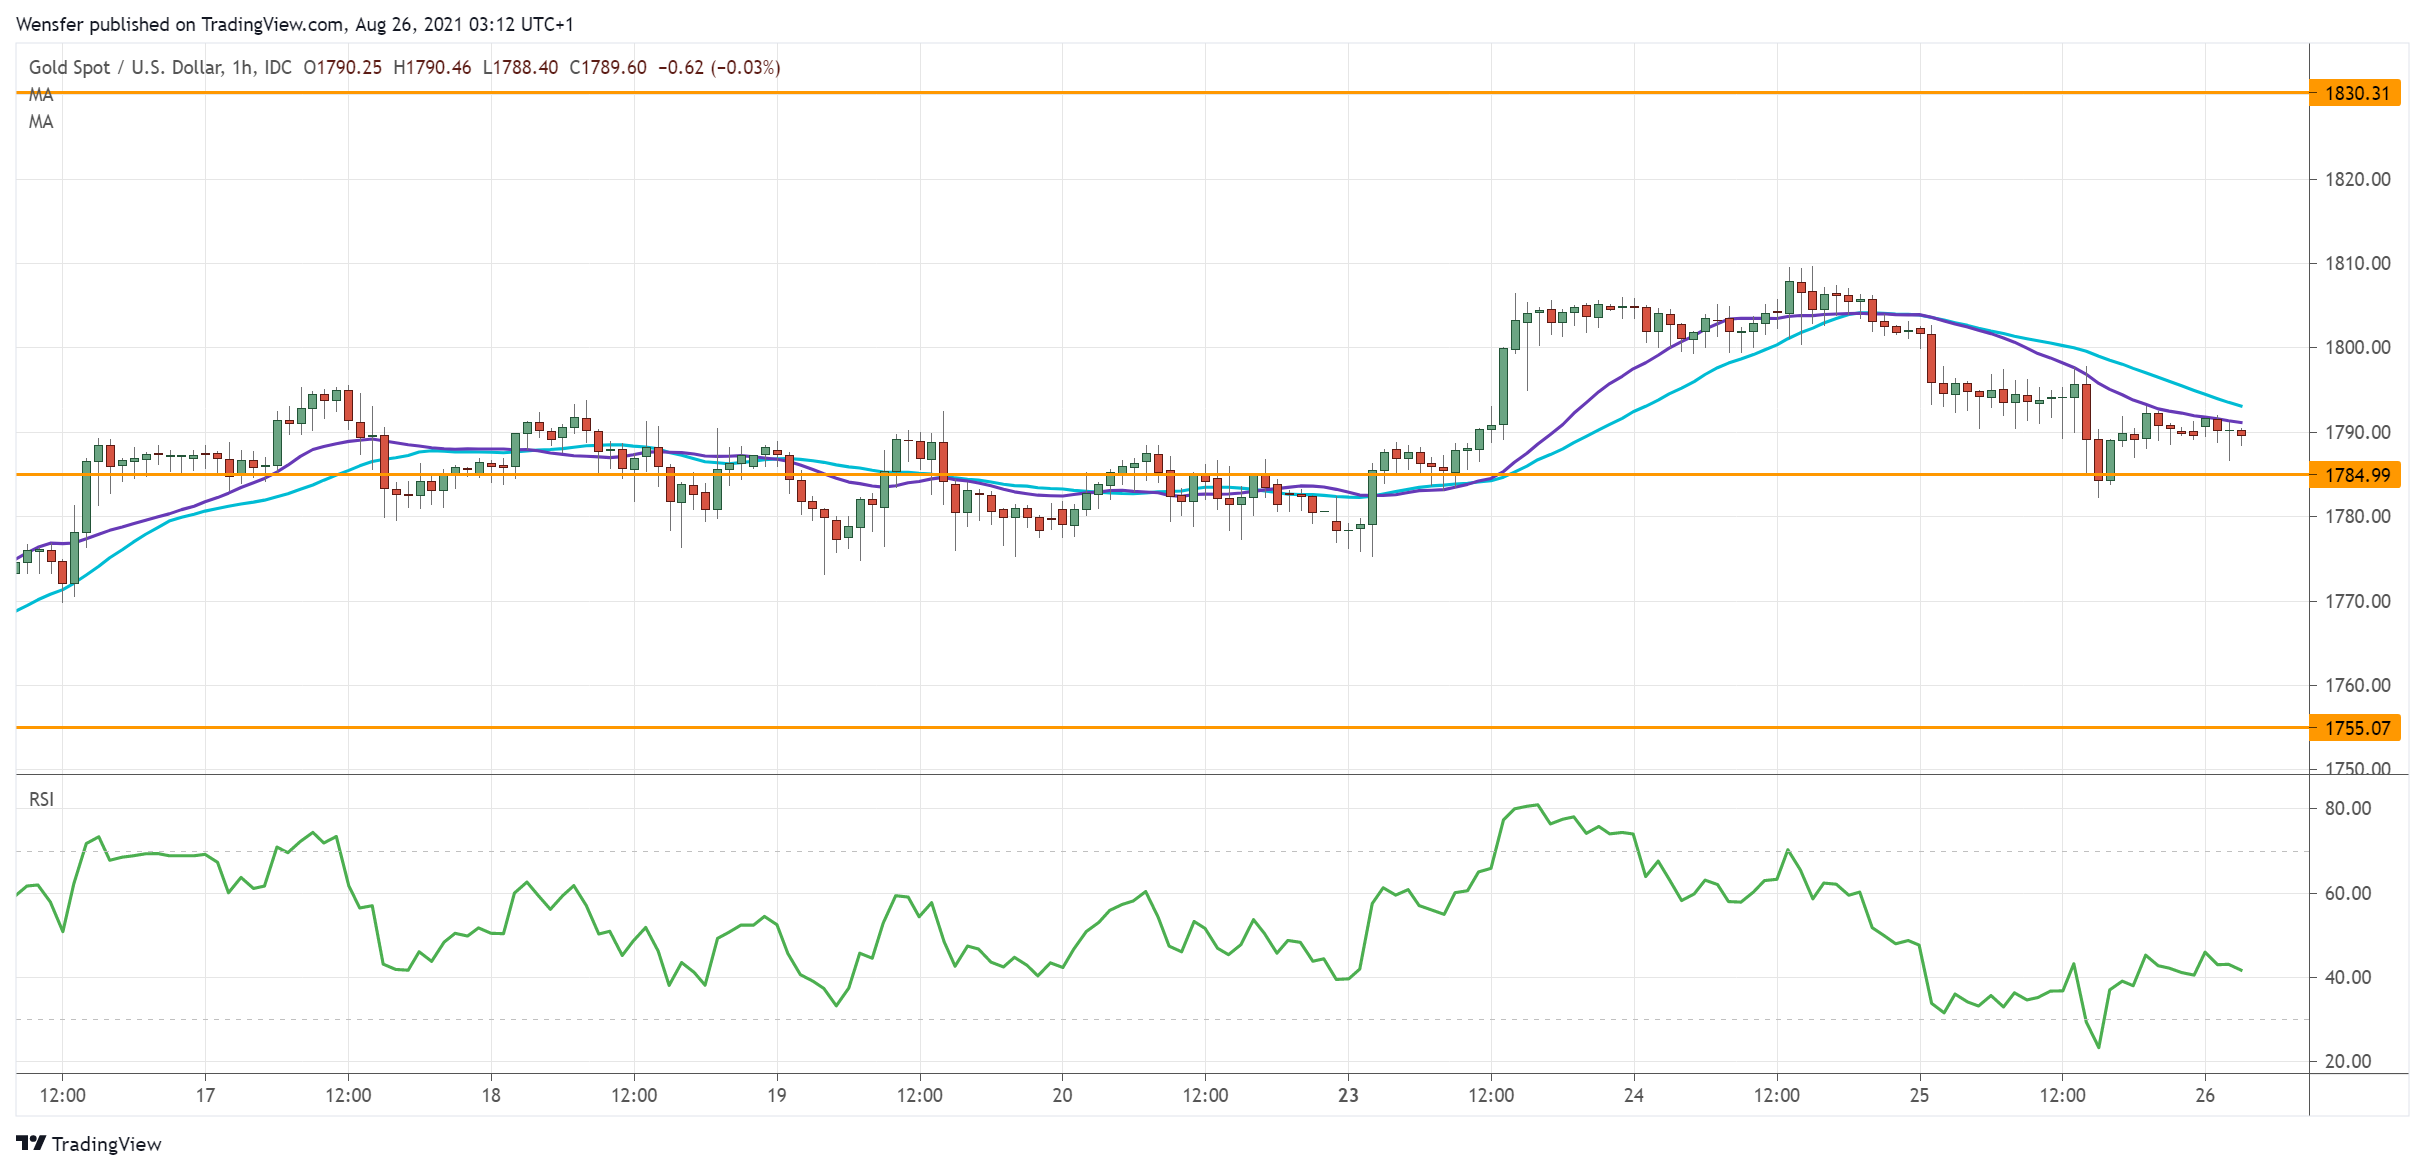
The US dollar’s weakness continues to fuel the gold rush.
The precious metal has recouped most losses from the crash earlier this month. The rapid recovery indicates traders’ strong willingness to buy the dips.
The price is about to test the major supply zone between 1810 and 1830 from the daily chart. Analysts can expect stiff selling pressure as short-term buyers take profit.
A bullish breakout may jump-start the uptrend once again. As the RSI goes muted, 1785 is the first level to gauge the strength of the rebound.
Free Reports:
 Download Our Metatrader 4 Indicators – Put Our Free MetaTrader 4 Custom Indicators on your charts when you join our Weekly Newsletter
 Get our Weekly Commitment of Traders Reports - See where the biggest traders (Hedge Funds and Commercial Hedgers) are positioned in the futures markets on a weekly basis.
USDNOK retreats to critical support

The commodity-linked Norwegian krone strengthened as oil prices recovered.
The greenback had met stiff selling pressure at the double top (9.1000). The subsequent break below 8.8800 suggests that hands are weak on the long side.
Profit-taking and fresh selling have sent the price to 8.7800, which is critical support from the daily timeframe. Its breach could signal a bearish reversal.
An oversold RSI may attract some buying interest, but the bulls will need to lift offers around 8.9200 before they could push for a rebound.
USOIL heads towards daily resistance

WTI crude rallied after the EIA showed a drop in the US inventories.
Price action continues on its upward journey after it bounced off May’s low at 62.00. A bullish RSI divergence at that major support suggested that the selling pressure was fading.
The rally above 67.40 is a confirmation that buyers have taken over. 69.50 is the hurdle ahead and a breakout may end a seven-week long consolidation and resume the uptrend.
An overbought RSI may trigger a limited pullback. 65.70 would be the first support in that case.
By Orbex

- COT Metals Charts: Speculator Bets led by Silver, Gold & Platinum Mar 7, 2026
- COT Bonds Charts: Speculator Bets led by 10-Year Bonds & Fed Funds Mar 7, 2026
- COT Energy Charts: Speculator Bets led by Brent Oil & Heating Oil Mar 7, 2026
- COT Soft Commodities Charts: Speculator Bets led by Corn & Soybean Meal Mar 7, 2026
- Investors run to safe-haven assets amid Middle East escalation Mar 6, 2026
- EUR/USD Under Pressure: Middle East Risks Outweigh All Else Mar 6, 2026
- Bitcoin shows resilience to Middle East events. Oil market stabilizes Mar 5, 2026
- GBP/USD: Market Not Expecting BoE Rate Cut in March Mar 5, 2026
- Brent headed for $100? Mar 4, 2026
- Global stock indices continue sell-off due to Middle East conflict Mar 4, 2026