
Article By RoboForex.com
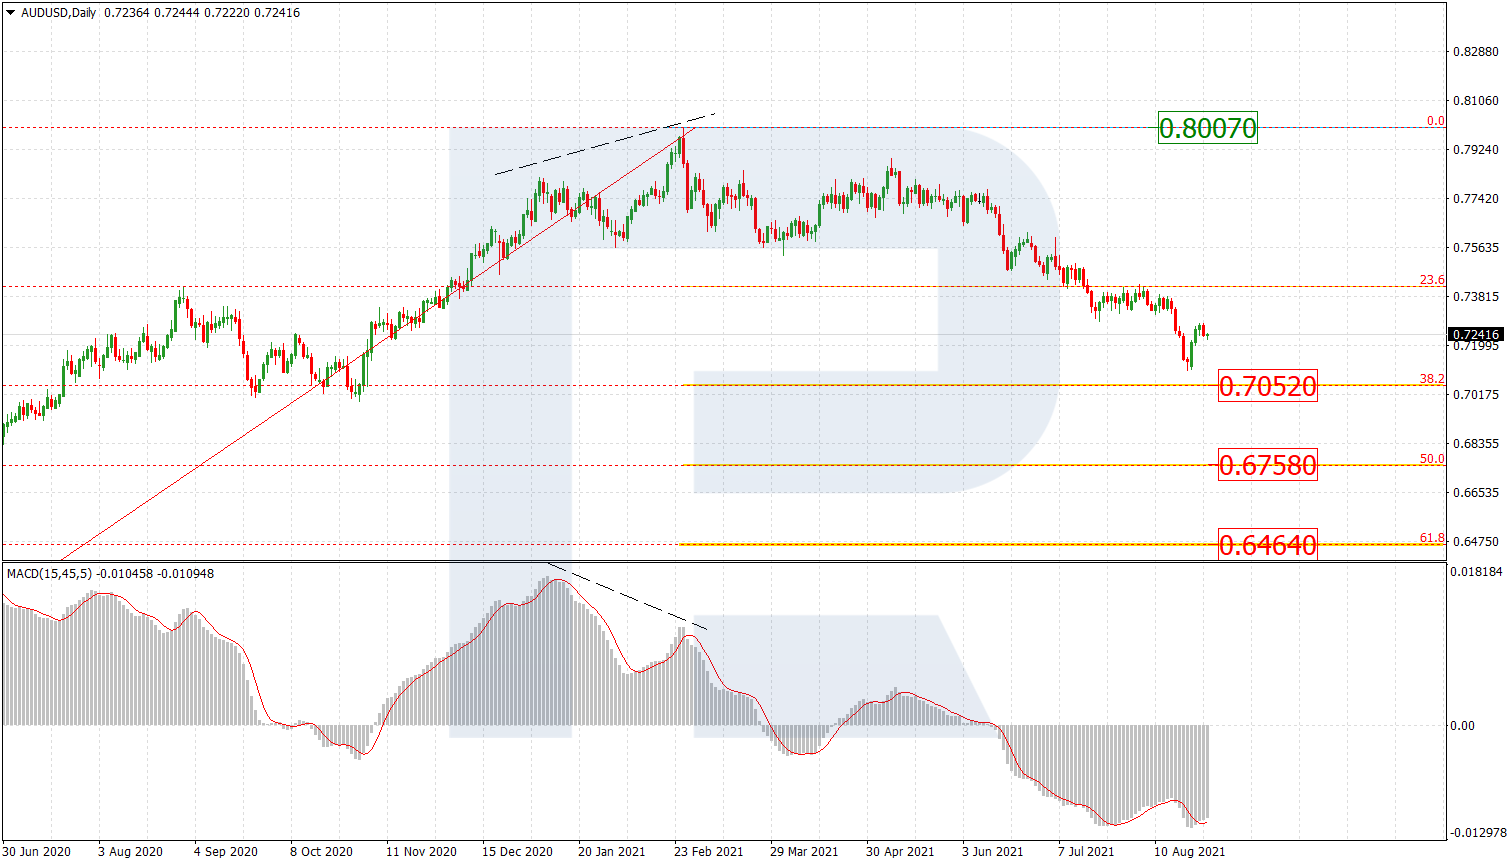
AUDUSD, “Australian Dollar vs US Dollar”
In the daily chart, the downtrend is looking quite stable despite the current correction to the upside, which started after an attempt to test 38.2% at 0.7052. After the pullback is over, the asset may continue trading towards 50.0% and 61.8% fibo at 0.6758 and 0.6464 respectively. The key resistance is the high at 0.8007.

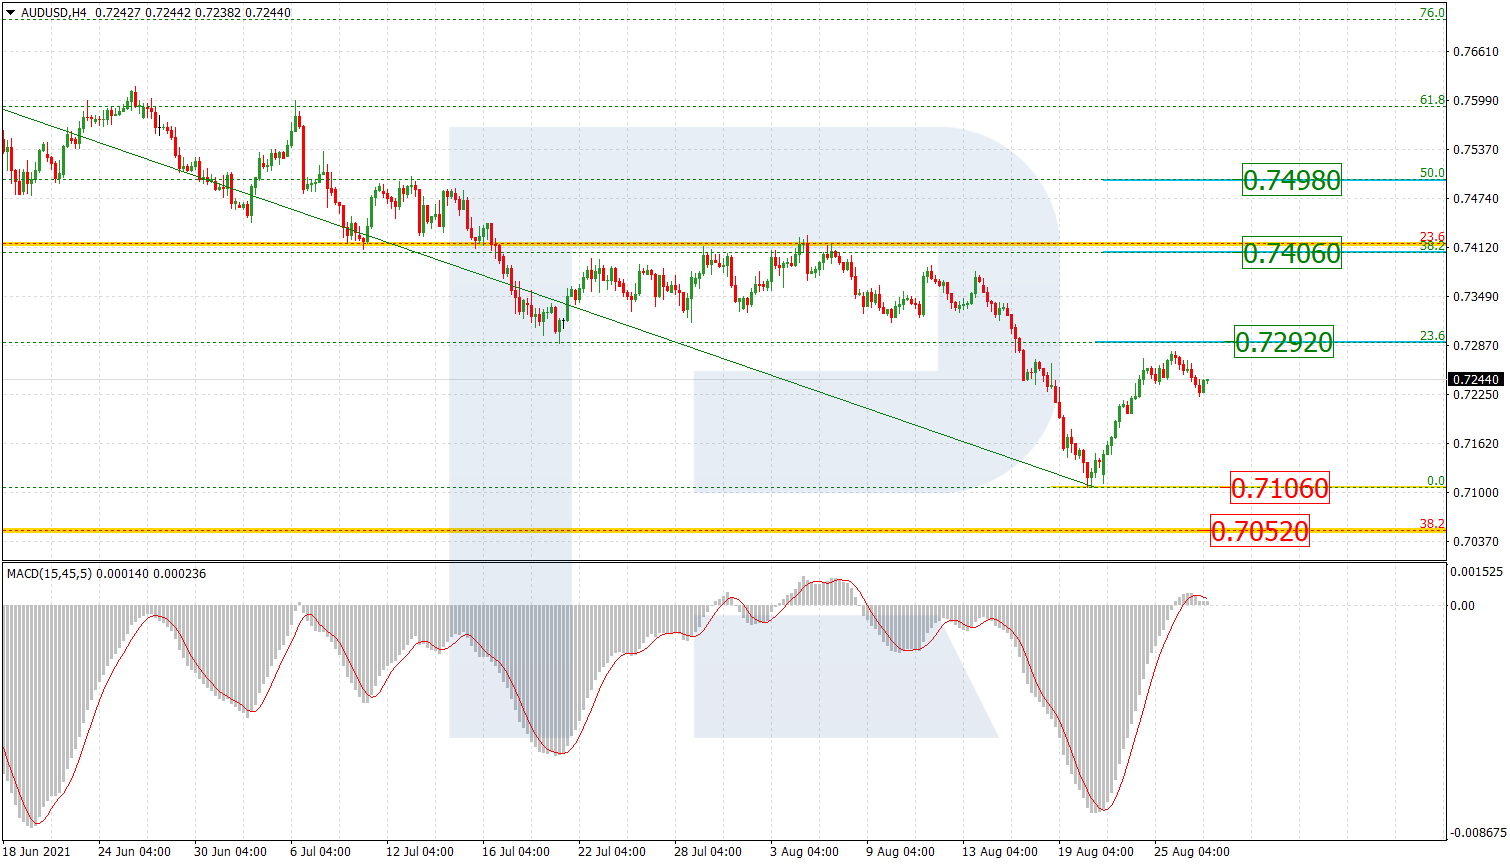
The H4 chart of AUDUSD shows the potential upside correctional targets are convergence on MACD – 23,6%, 38.2%, and 50.0% at 0.7292, 0.7406, and 0.7498 respectively. A breakout of the local support at 0.7106 will lead to a further mid-term downtrend.
Free Reports:
 Get our Weekly Commitment of Traders Reports - See where the biggest traders (Hedge Funds and Commercial Hedgers) are positioned in the futures markets on a weekly basis.
 Download Our Metatrader 4 Indicators – Put Our Free MetaTrader 4 Custom Indicators on your charts when you join our Weekly Newsletter
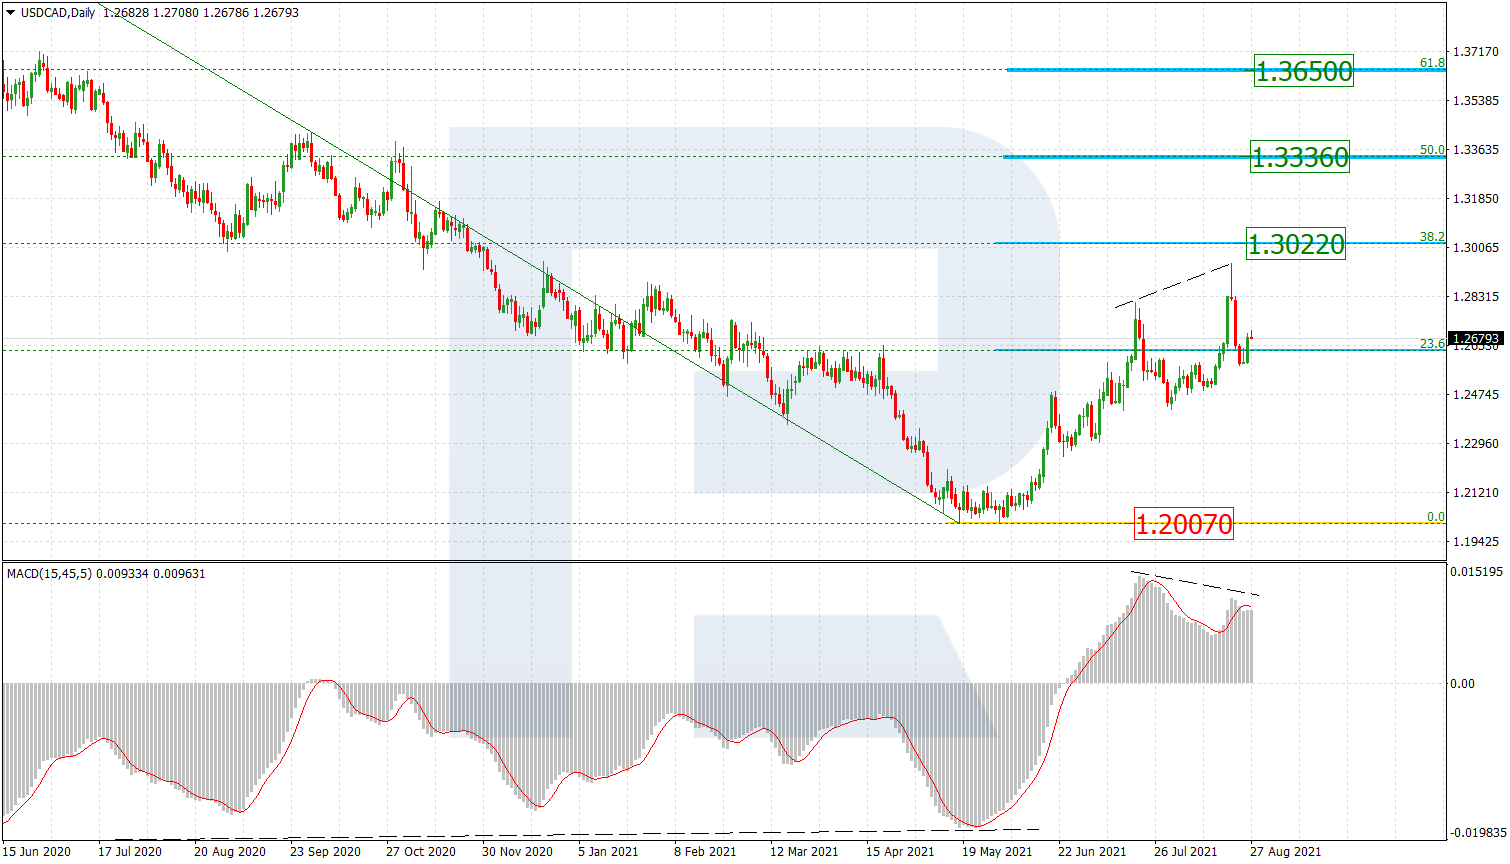
USDCAD, “US Dollar vs Canadian Dollar”
As we can see in the daily chart, after an attempt to reach 38.2% fibo at 1.3022 and local divergence on MACD, the pair is correcting downwards. After finishing the pullback, the asset may form a new wave to the upside with the targets at 50.0% and 61.8% fibo at 1.3336 and 1.3650 respectively. The key support remains at the low at 1.2007.
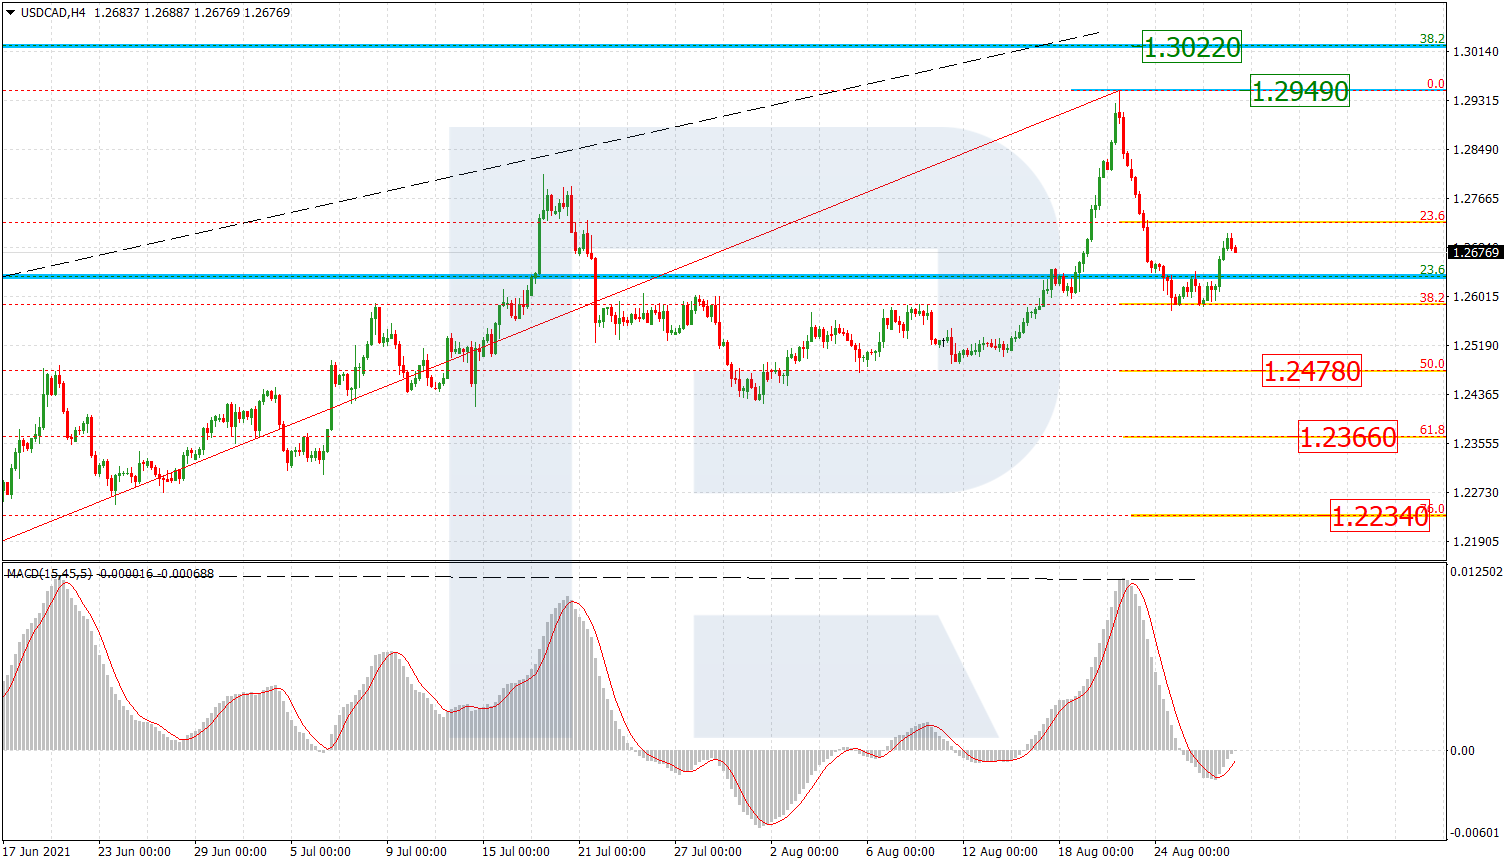
The H4 chart shows the potential targets of the current descending correction. After divergence on MACD, the pair was falling and reached 38.2% but then rebounded from it. The next descending impulse may head towards 50.0%, 61.8%, and 76.0% fibo at 1.2478, 1.2366, and 1.2234 respectively. The local resistance is the fractal high at 1.2949.
Article By RoboForex.com
Attention!
Forecasts presented in this section only reflect the author’s private opinion and should not be considered as guidance for trading. RoboForex LP bears no responsibility for trading results based on trading recommendations described in these analytical reviews.

- COT Metals Charts: Speculator Bets led by Silver, Gold & Platinum Mar 7, 2026
- COT Bonds Charts: Speculator Bets led by 10-Year Bonds & Fed Funds Mar 7, 2026
- COT Energy Charts: Speculator Bets led by Brent Oil & Heating Oil Mar 7, 2026
- COT Soft Commodities Charts: Speculator Bets led by Corn & Soybean Meal Mar 7, 2026
- Investors run to safe-haven assets amid Middle East escalation Mar 6, 2026
- EUR/USD Under Pressure: Middle East Risks Outweigh All Else Mar 6, 2026
- Bitcoin shows resilience to Middle East events. Oil market stabilizes Mar 5, 2026
- GBP/USD: Market Not Expecting BoE Rate Cut in March Mar 5, 2026
- Brent headed for $100? Mar 4, 2026
- Global stock indices continue sell-off due to Middle East conflict Mar 4, 2026