
Article By RoboForex.com
XAUUSD, “Gold vs US Dollar”
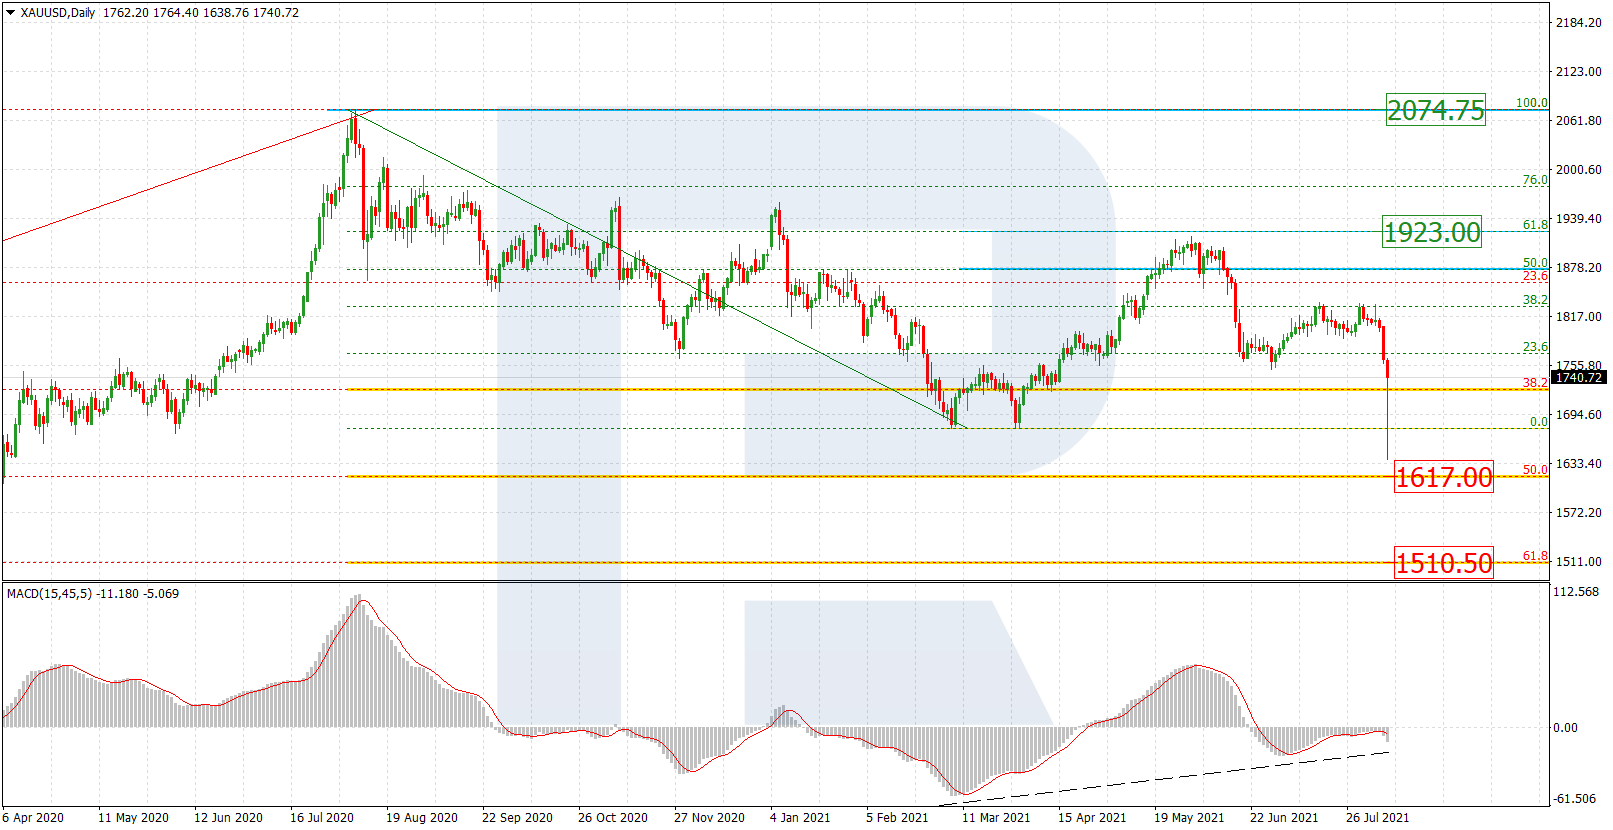
On today’s D1, one cannot skip a deep decline of the quotations. They have broken through the previous low of 1676.78 but failed to reach 50.0% (1617.00) Fibo. Today the market is pulling back. The correction might take long but the next impulse of decline will be aimed at 61.8% (1510.50). Meanwhile, there is a convergence forming on the MACD, which might mean there is the last wave of the bearish phase developing.

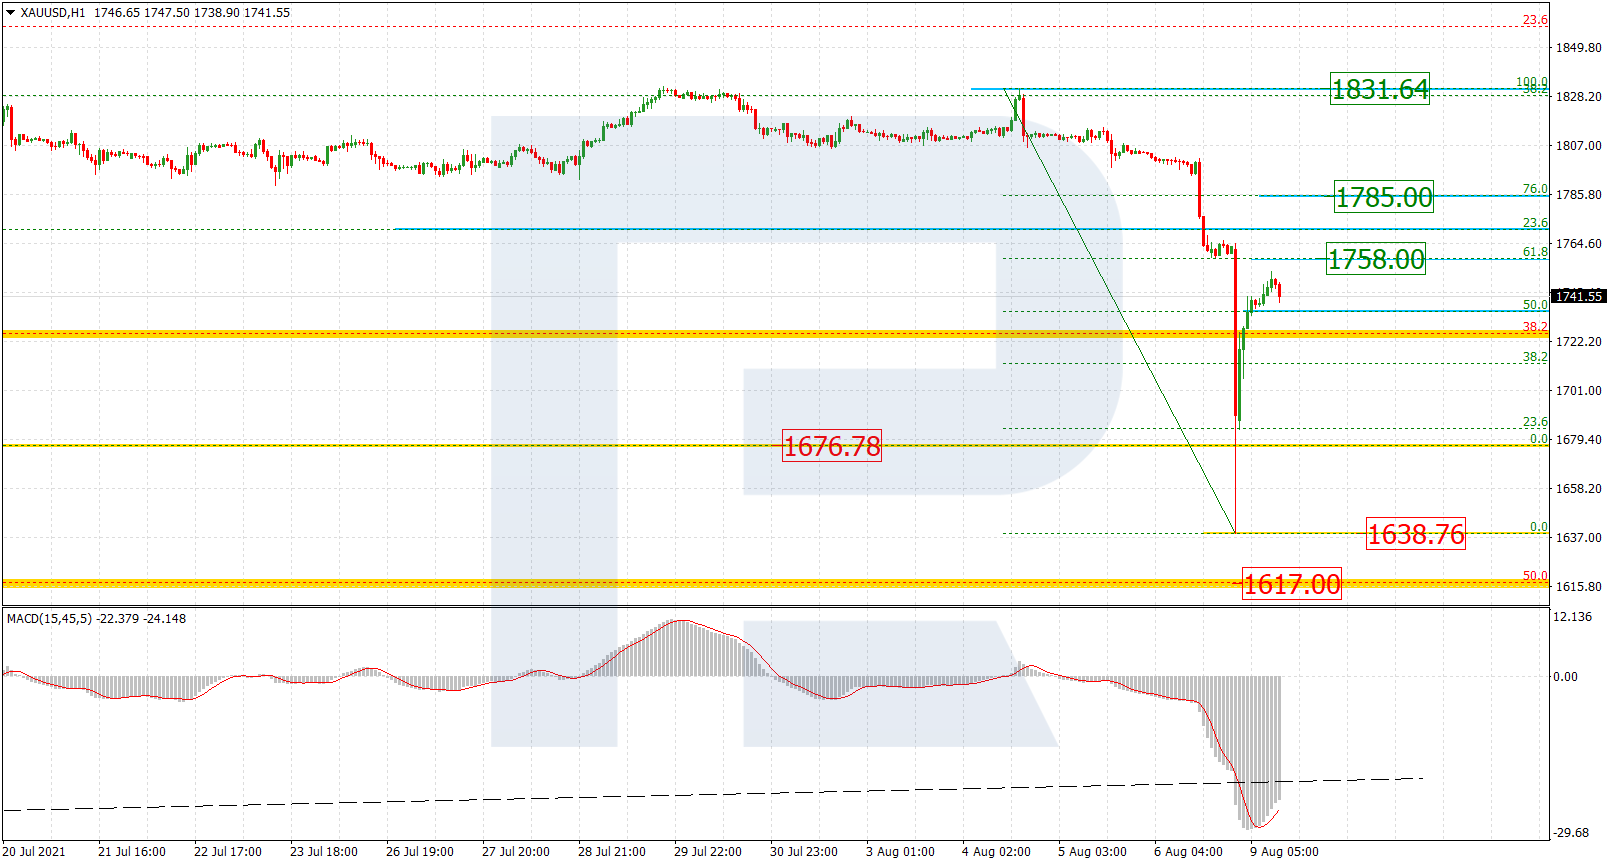
On H1, gold is growing in a correction of the descending wave. It rose over 50.0% but failed to test 61.8% (1758.00) Fibo. It can still rise to 76.0% (1785.00), but a breakaway of this level and the fractal resistance of 1831.64 will signal a reversal of the medium-tefm trend. When the correction is over, the next goal of decline will head for the local low of 1638.76.
Free Reports:
 Download Our Metatrader 4 Indicators – Put Our Free MetaTrader 4 Custom Indicators on your charts when you join our Weekly Newsletter
 Get our Weekly Commitment of Traders Reports - See where the biggest traders (Hedge Funds and Commercial Hedgers) are positioned in the futures markets on a weekly basis.
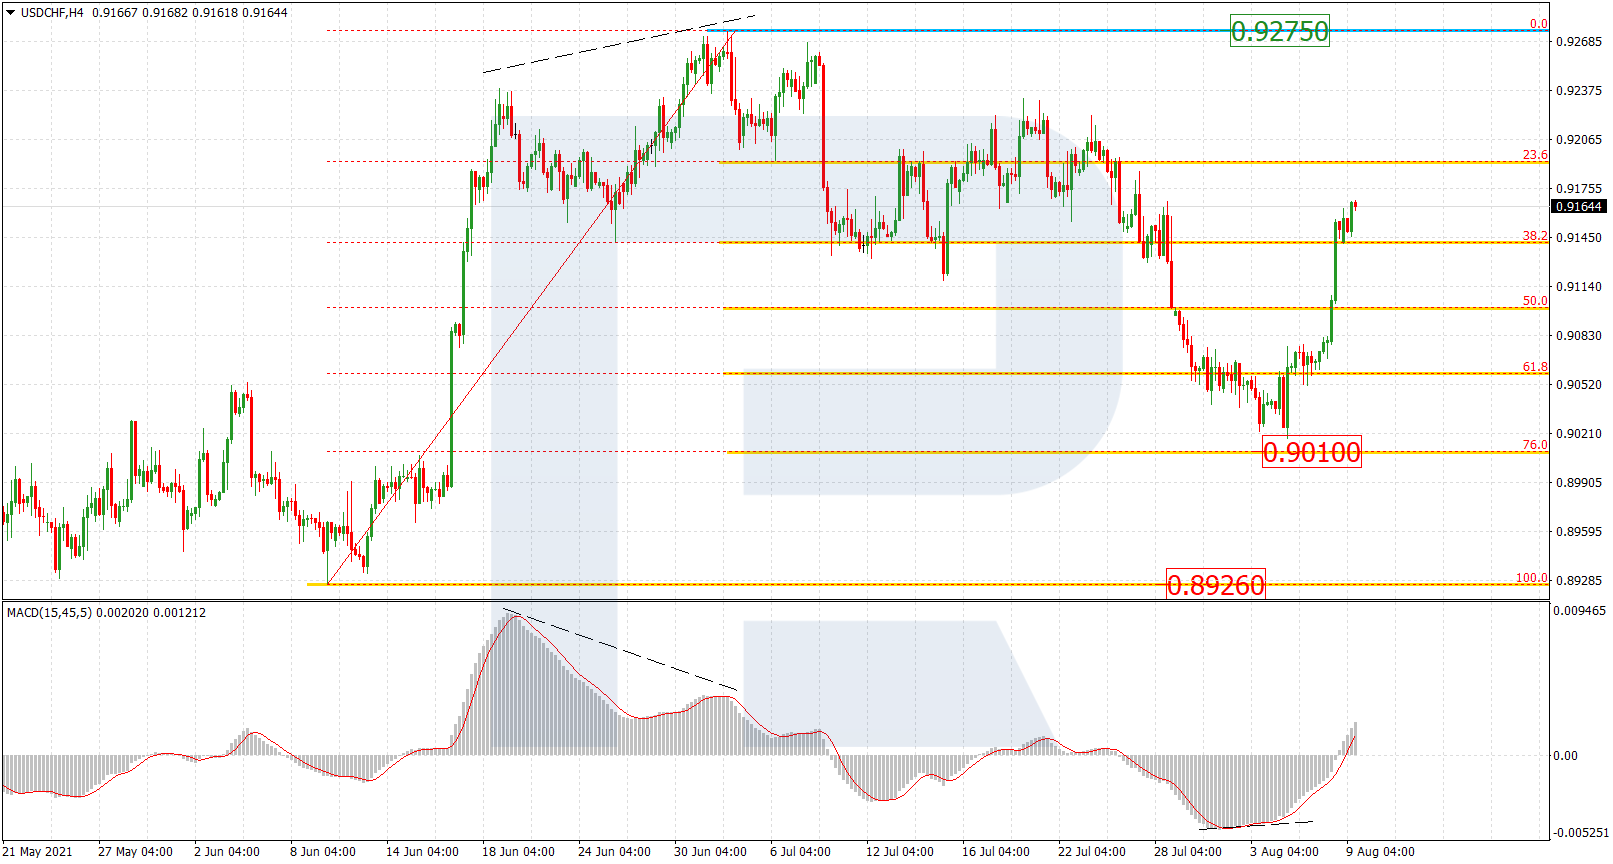
USDCHF, “US Dollar vs Swiss Franc”
On H1, gold is growing in a correction of the descending wave. It rose over 50.0% but failed to test 61.8% (1758.00) Fibo. It can still rise to 76.0% (1785.00), but a breakaway of this level and the fractal resistance of 1831.64 will signal a reversal of the medium-tefm trend. When the correction is over, the next goal of decline will head for the local low of 1638.76.
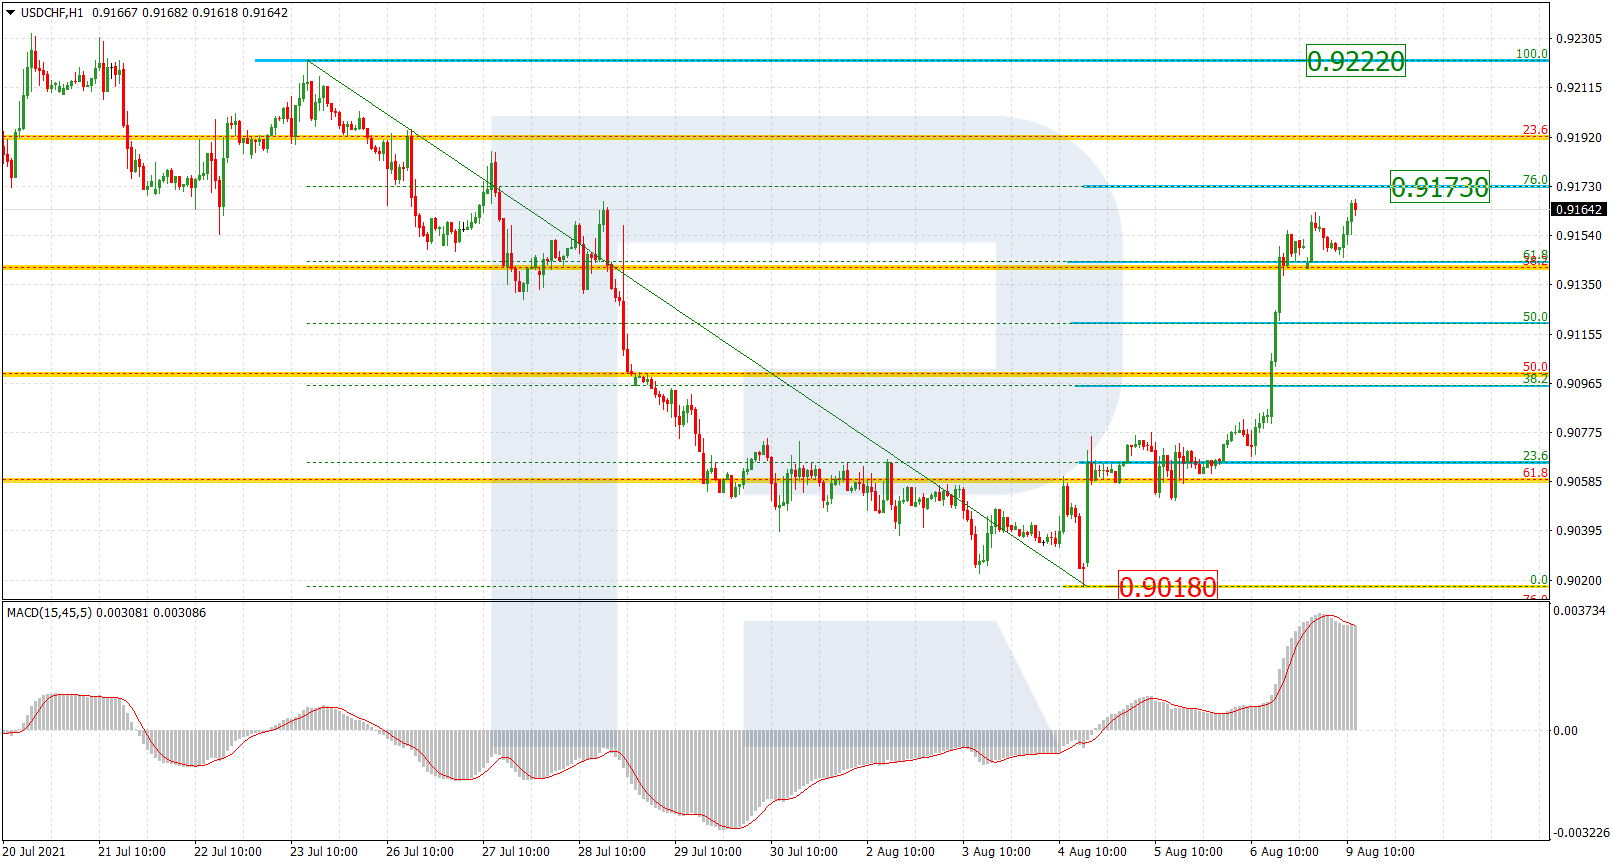
On H1, the ascending correction can be seen in detail. The growth is heading for 76.0% (0.9173) Fibo, while the resistance level is at the high of 0.9222. A breakaway of 0.9018 will signal the development of the downtrend.
Article By RoboForex.com
Attention!
Forecasts presented in this section only reflect the author’s private opinion and should not be considered as guidance for trading. RoboForex LP bears no responsibility for trading results based on trading recommendations described in these analytical reviews.

- COT Metals Charts: Speculator Bets led by Silver, Gold & Platinum Mar 7, 2026
- COT Bonds Charts: Speculator Bets led by 10-Year Bonds & Fed Funds Mar 7, 2026
- COT Energy Charts: Speculator Bets led by Brent Oil & Heating Oil Mar 7, 2026
- COT Soft Commodities Charts: Speculator Bets led by Corn & Soybean Meal Mar 7, 2026
- Investors run to safe-haven assets amid Middle East escalation Mar 6, 2026
- EUR/USD Under Pressure: Middle East Risks Outweigh All Else Mar 6, 2026
- Bitcoin shows resilience to Middle East events. Oil market stabilizes Mar 5, 2026
- GBP/USD: Market Not Expecting BoE Rate Cut in March Mar 5, 2026
- Brent headed for $100? Mar 4, 2026
- Global stock indices continue sell-off due to Middle East conflict Mar 4, 2026