
Article By RoboForex.com
XAUUSD, “Gold vs US Dollar”
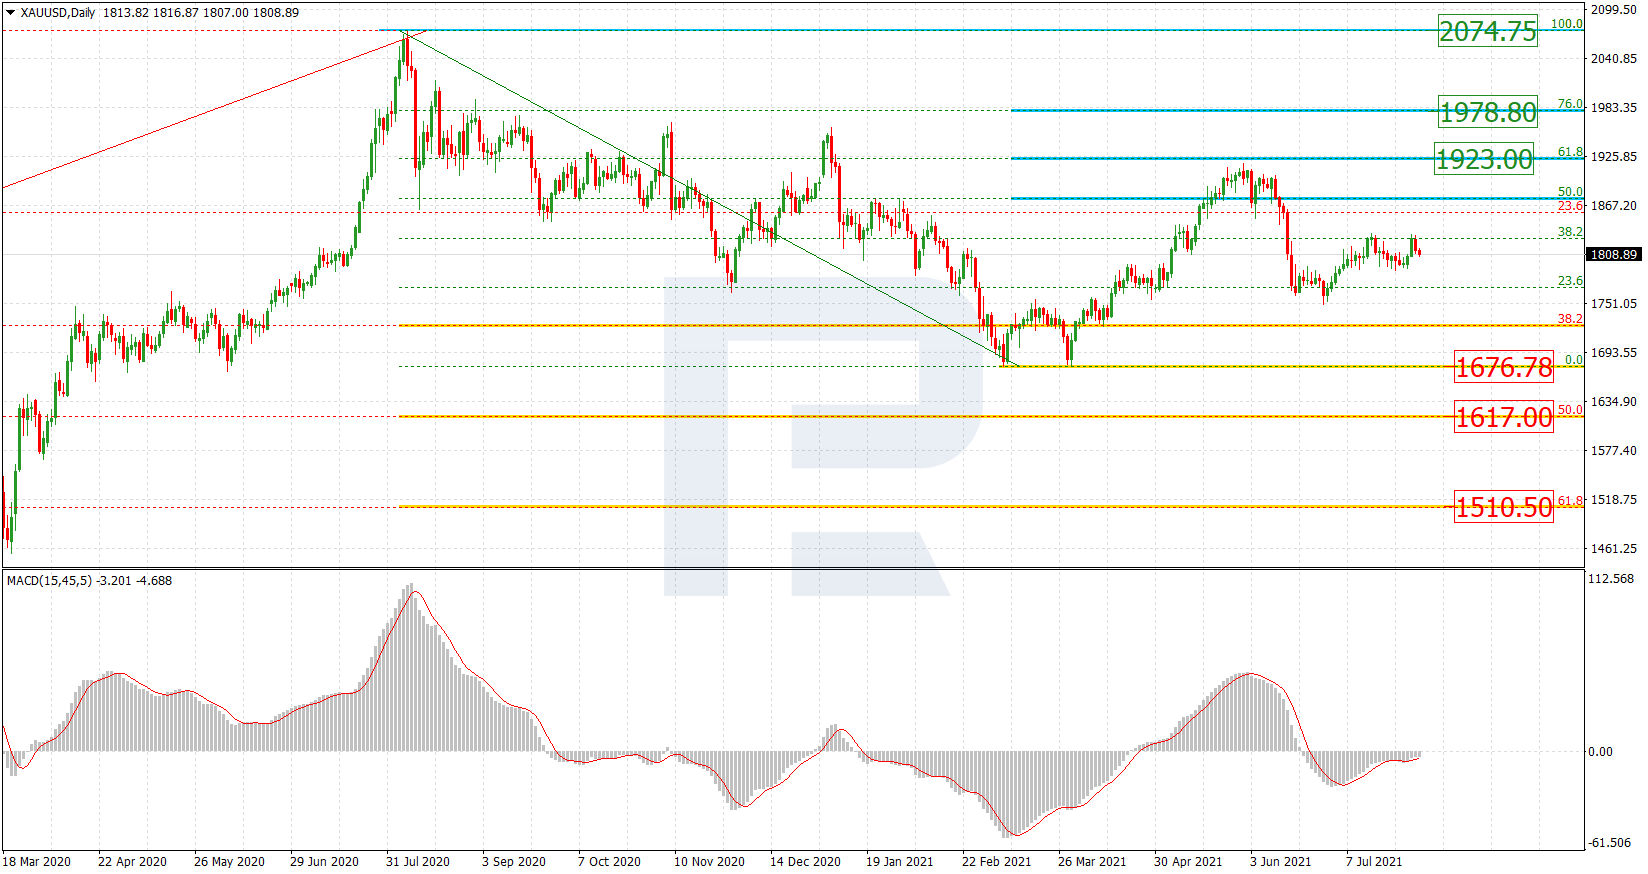
On D1 of gold, the last wave of growth tried to test the level of 61.8% (1923.00) Fibonacci but the quotations then dropped. Current growth may be interpreted as another attempt to raise gold prices but the market seems to lack power. In these circumstances, we should expect a wave of decline to break through the low of 1676.78. After a breakaway of the low, the quotations will be able to go on declining to 50.0% (1617.00) and 61.8% (1510.50). If the breakaway fails and turns into a bounce, another wave of growth will aim at 76.0% (1978.80) and the high of 2074.75.

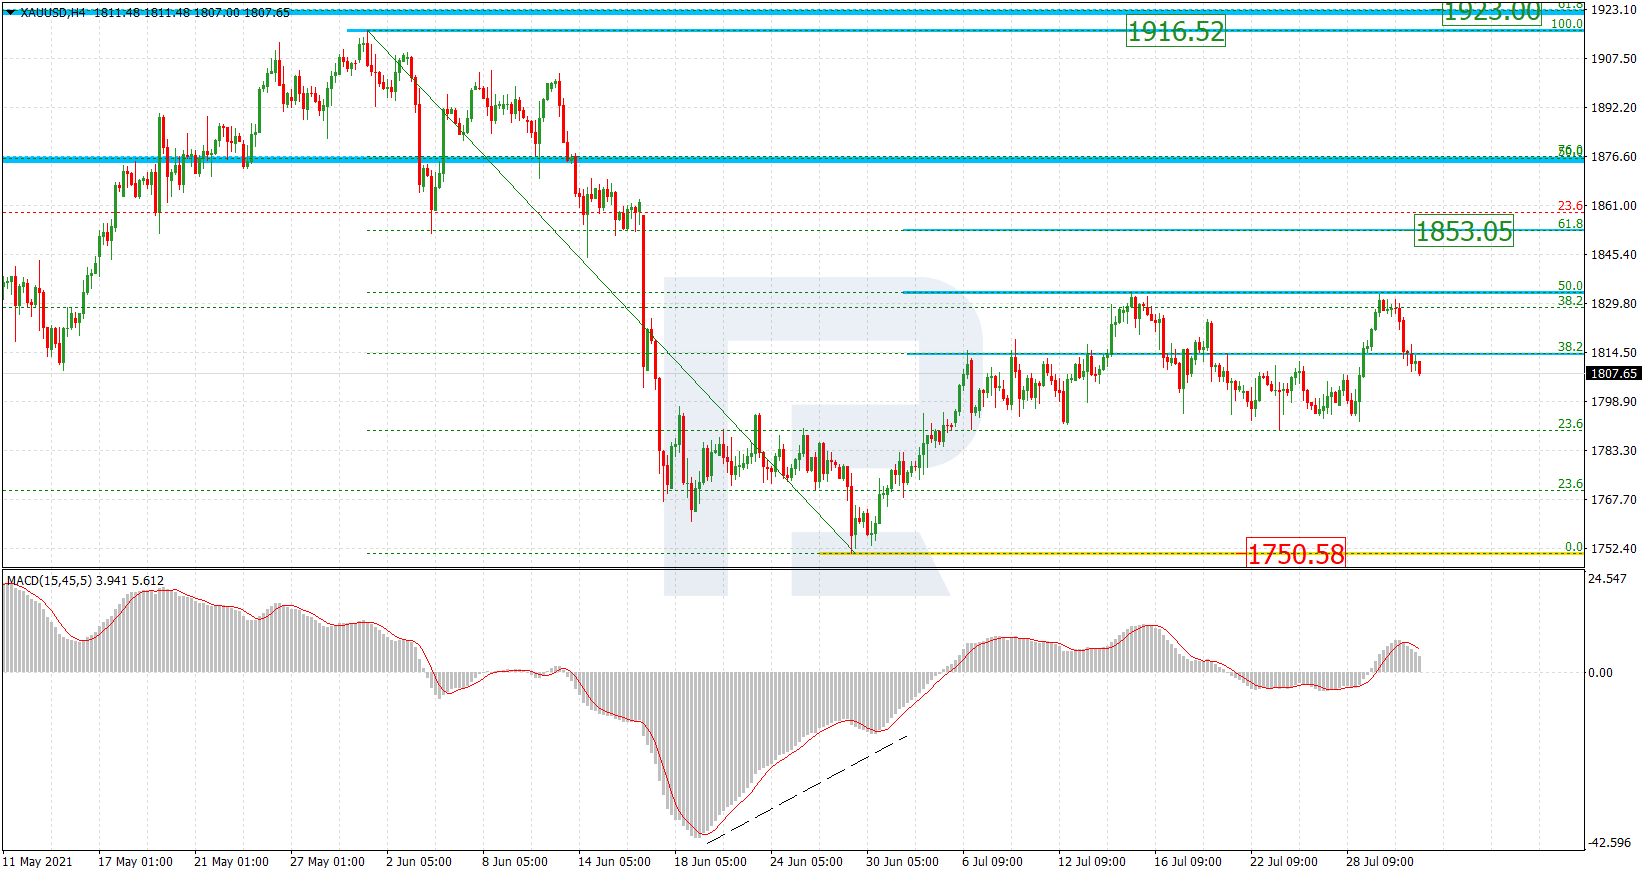
On H4, we can see the market test 50.0% twice after a convergence, which means this resistance level is strong. Another impulse of growth in the local correction phase will aim at 61.8% (1853.05). However, in the nearest future, we should expect a decline to the latest low at 1750.58.
Free Reports:
 Get our Weekly Commitment of Traders Reports - See where the biggest traders (Hedge Funds and Commercial Hedgers) are positioned in the futures markets on a weekly basis.
 Sign Up for Our Stock Market Newsletter – Get updated on News, Charts & Rankings of Public Companies when you join our Stocks Newsletter
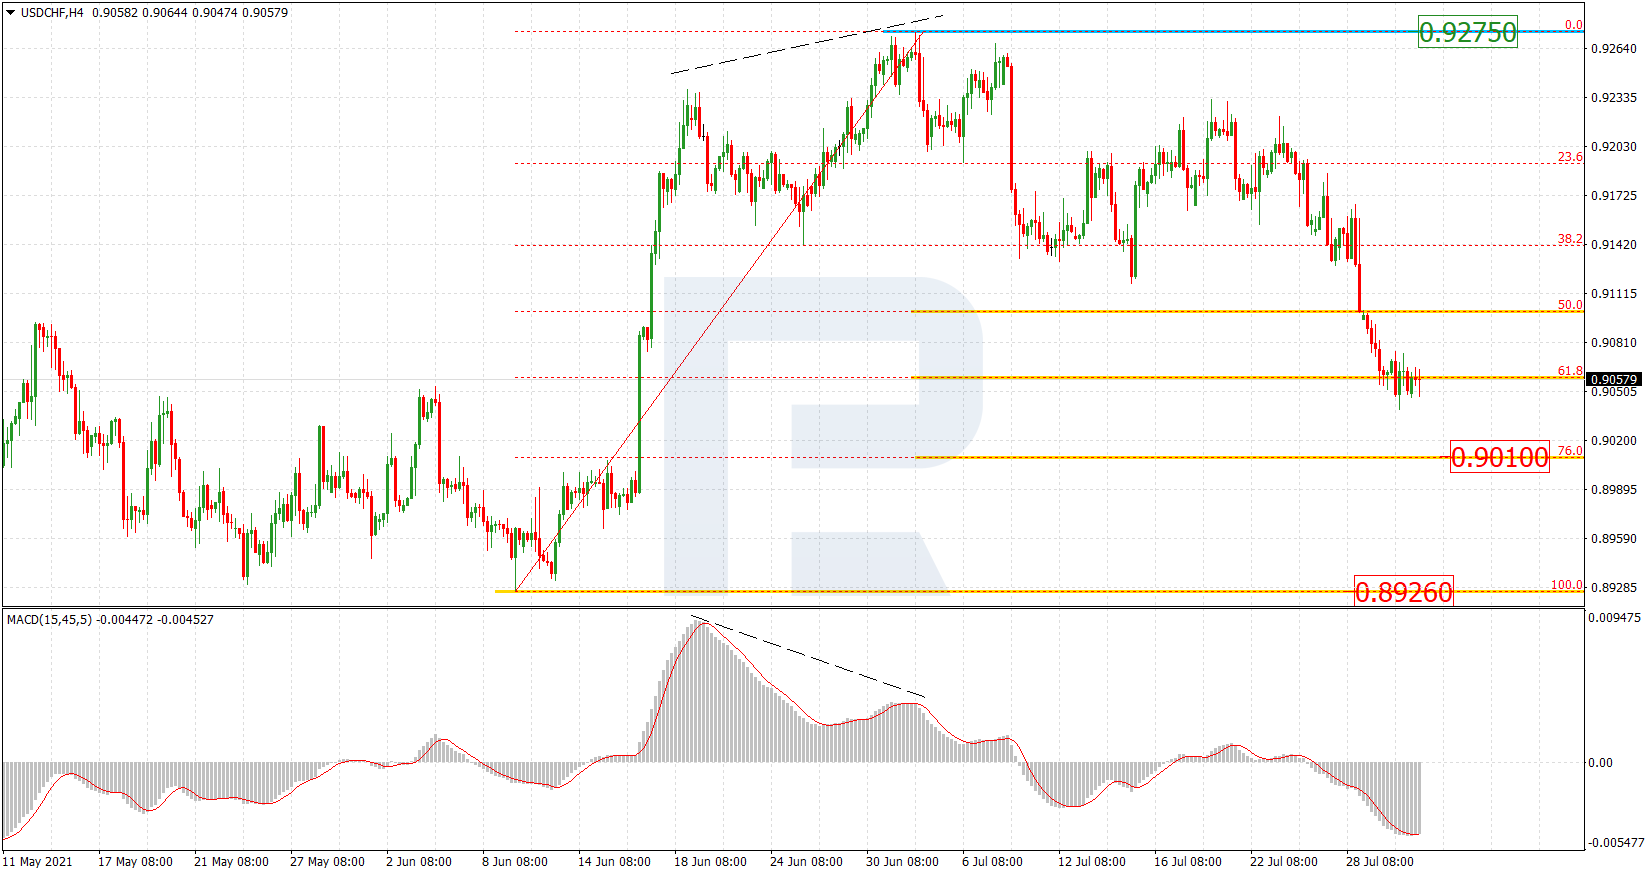
USDCHF, “US Dollar vs Swiss Franc”
On H4, the quotations gave reached 61.8% Fibo as a correction after a wave of growth and a divergence. The next goal of the decline after a short-term correction should be 76.0% (0.9010) and the low of 0.8926. Resistance is at the peak of 0.9275.
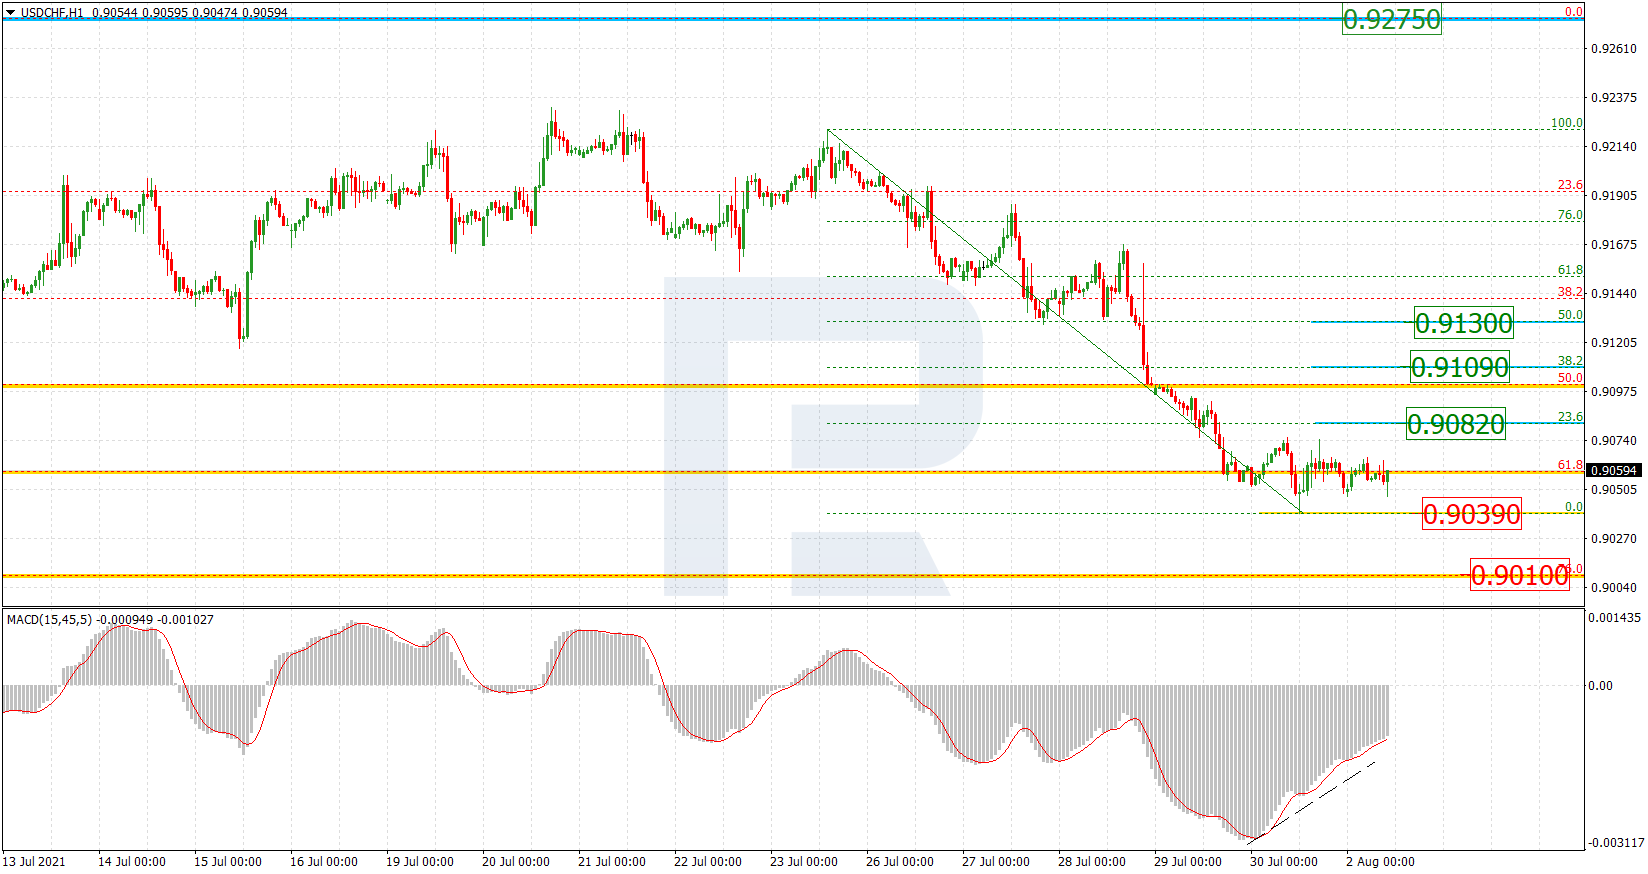
H1 can help us determine the potential goals of the ascending correction after the local convergence. Correctional growth might be aiming at 23.6% (0.9082), 38.2% (0.9109), and 50.0% (0.9130) Fibo. A breakaway of the low of 0.9039 will signal the development of a downtrend.
Article By RoboForex.com
Attention!
Forecasts presented in this section only reflect the author’s private opinion and should not be considered as guidance for trading. RoboForex LP bears no responsibility for trading results based on trading recommendations described in these analytical reviews.

- COT Metals Charts: Speculator Bets led by Silver, Gold & Platinum Mar 7, 2026
- COT Bonds Charts: Speculator Bets led by 10-Year Bonds & Fed Funds Mar 7, 2026
- COT Energy Charts: Speculator Bets led by Brent Oil & Heating Oil Mar 7, 2026
- COT Soft Commodities Charts: Speculator Bets led by Corn & Soybean Meal Mar 7, 2026
- Investors run to safe-haven assets amid Middle East escalation Mar 6, 2026
- EUR/USD Under Pressure: Middle East Risks Outweigh All Else Mar 6, 2026
- Bitcoin shows resilience to Middle East events. Oil market stabilizes Mar 5, 2026
- GBP/USD: Market Not Expecting BoE Rate Cut in March Mar 5, 2026
- Brent headed for $100? Mar 4, 2026
- Global stock indices continue sell-off due to Middle East conflict Mar 4, 2026