
By Ino.com
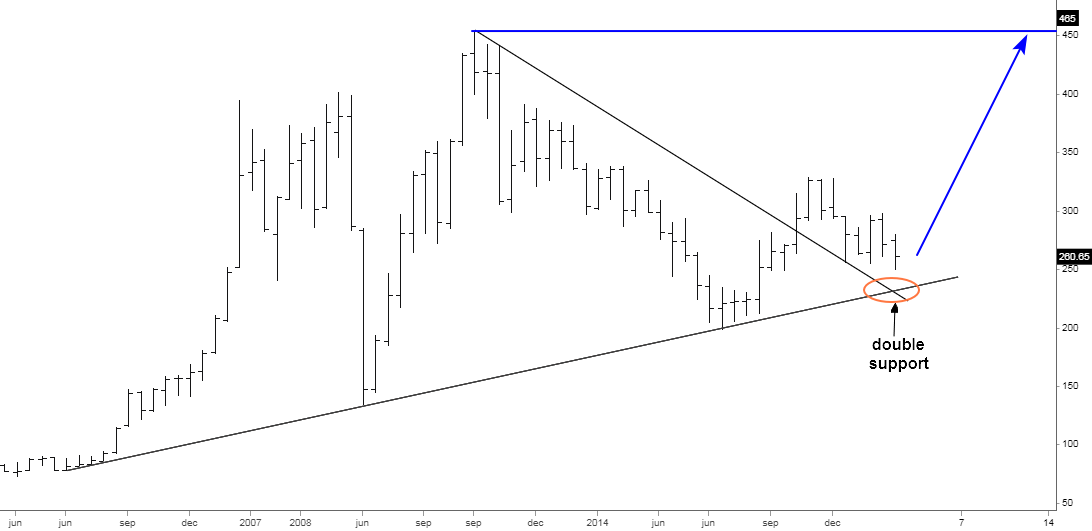
Almost two years ago, in my previous copper update, I called for a big jump of the metal’s price to an ambitious target of $4.65 in the quarterly chart. I put it below to refresh the memory.

Firstly, the price collapsed to pierce the double support shown in the chart. Only after that, it quickly rebounded to the upside as it hit the preset target of $4.65 this May. I hope you enjoyed that long rally.
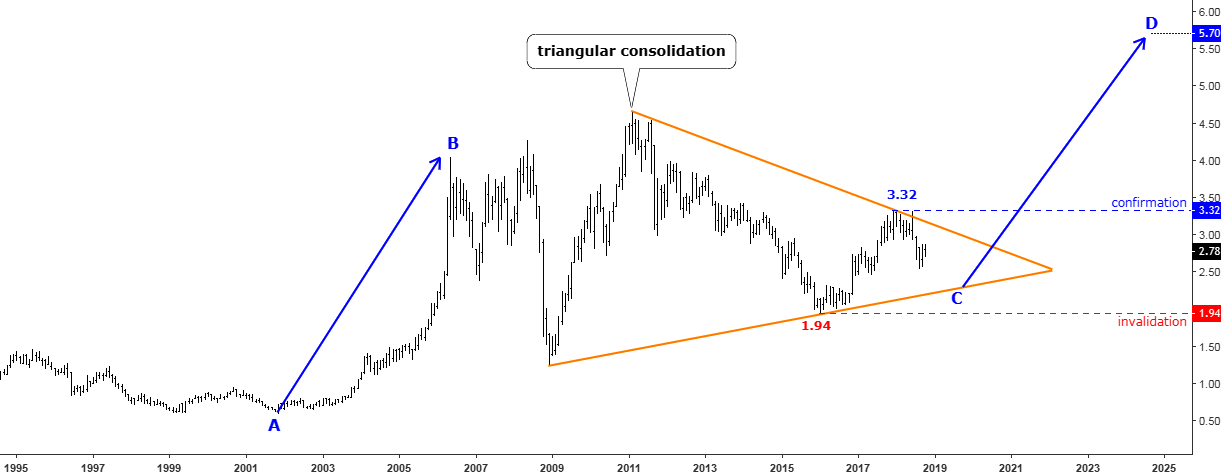
Another model, posted almost three years ago within an educational experiment advanced very well, although it did not hit the target yet, as did the pattern shown above. That charting exercise drew a lot of attention and feedback at that time. Moreover, the majority of readers bet on this well-known pattern.
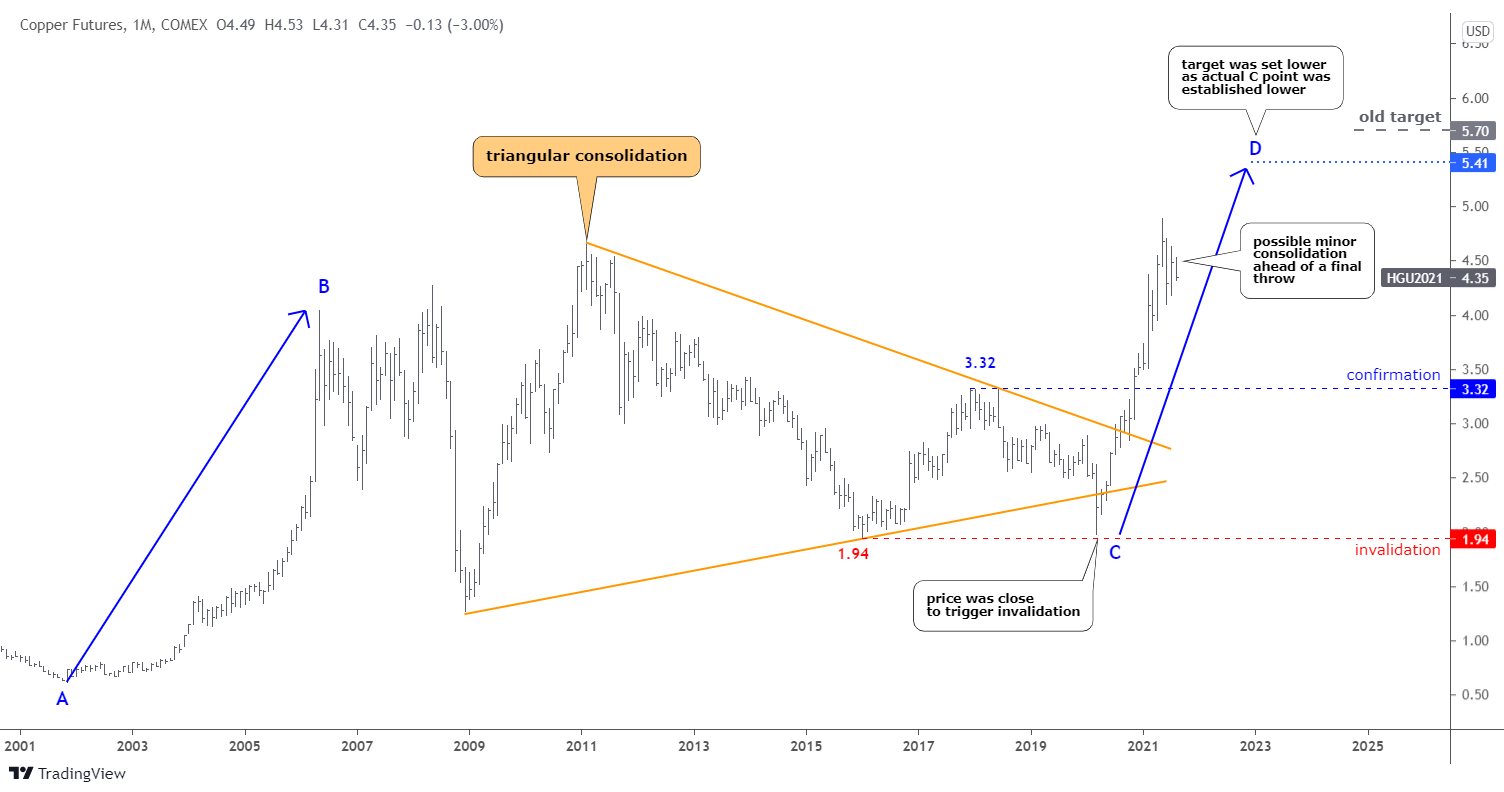
I kept the original annotations of 2018 in the chart for educational purposes as I only adjusted the CD part.
There was a massive sell-off in the market right after this model was posted. The price was just inches from collapsing through the invalidation trigger below $1.94. However, the copper survived, as we can see the following V-shape reversal in the chart last year. In this regard, the CD part was set lower to start from $1.97 with a target of $5.41.
Your 3-year long bet is doing well so far. The price advanced rapidly through the upper barrier of a Triangle (orange); there, it took a break within a minor consolidation as later it just rocketed beyond the confirmation trigger. Copper futures printed the new all-time high at $4.89 this May and then collapsed on profit-taking. Currently, the price is in a minor sideways consolidation between $4.09 and $4.89. The market is possibly accumulating the momentum for a final throw.
As long as the metal fluctuates within the large range between $1.25 and $4.65-$4.89, the following structure could emerge.
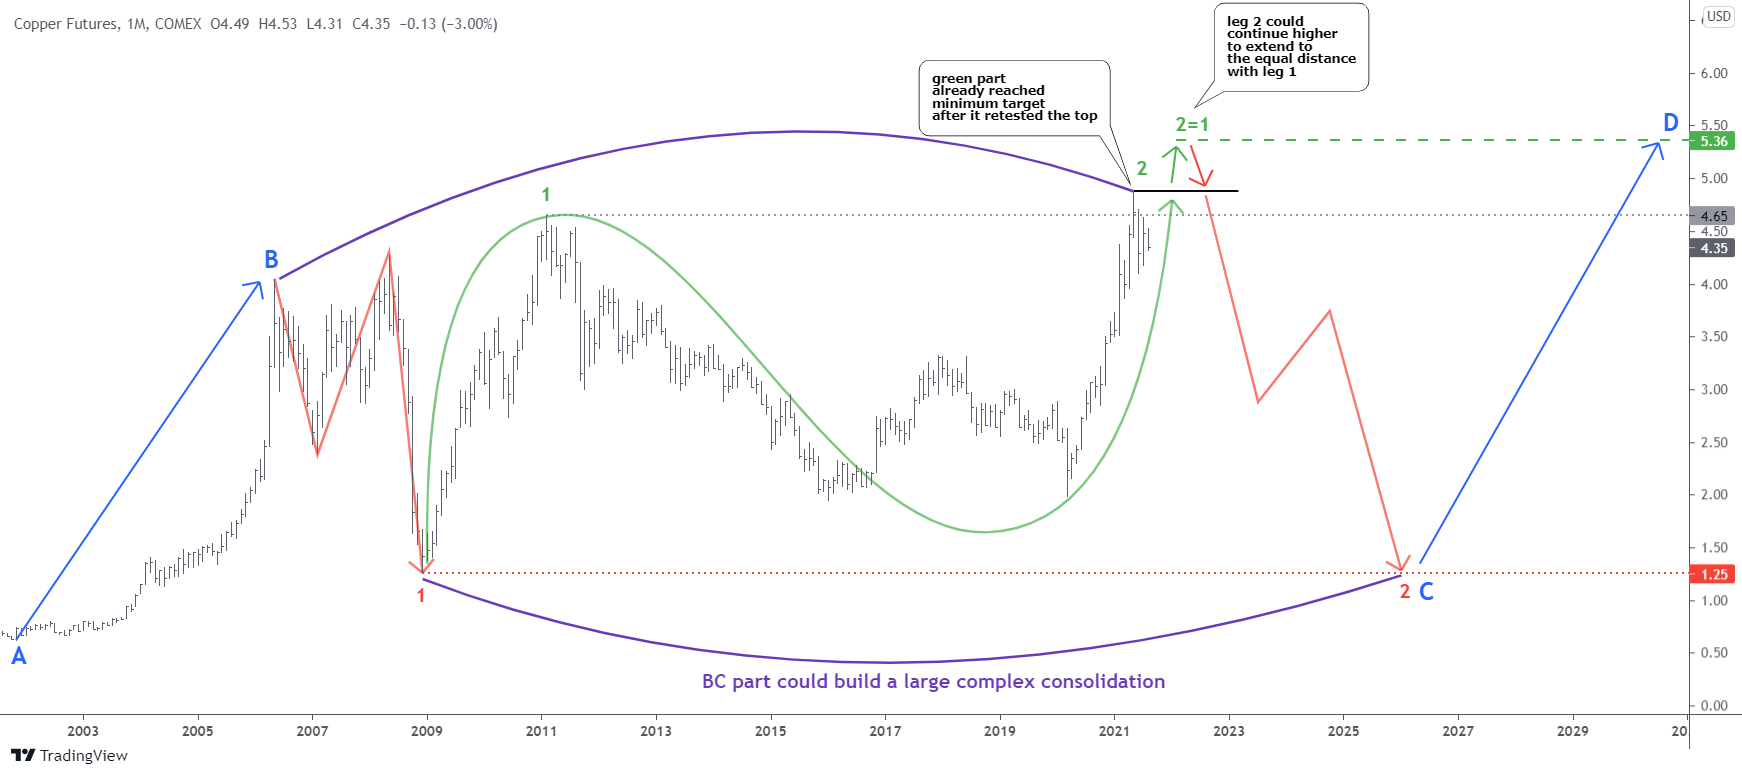
The current two-leg move to the upside (green) could be just the large interconnector between two legs to the downside (red). However, it means that the BC part (purple) could build a large complex consolidation.
I can see two possible options in the chart.
The first one implies the completion of green leg 2 as it already reached the minimum target when it retested the top of green leg 1. In this case, the red leg 2 down could already have kicked off. Therefore, it should tag the downside of the huge range at $1.25.
The second option does not change the entire structure as it only leaves room for another move to the upside to $5.36, where the green leg 2 would travel the same distance as the green leg 1. This path accords with the Triangular model shown in the chart above.
The CD part could be postponed for a longer period if this BC part would emerge. For that reason, it is early yet to calculate the target, as we need to make sure that the C point is established.
Let us see the copper market forecast in the table below to check the fundamental background.
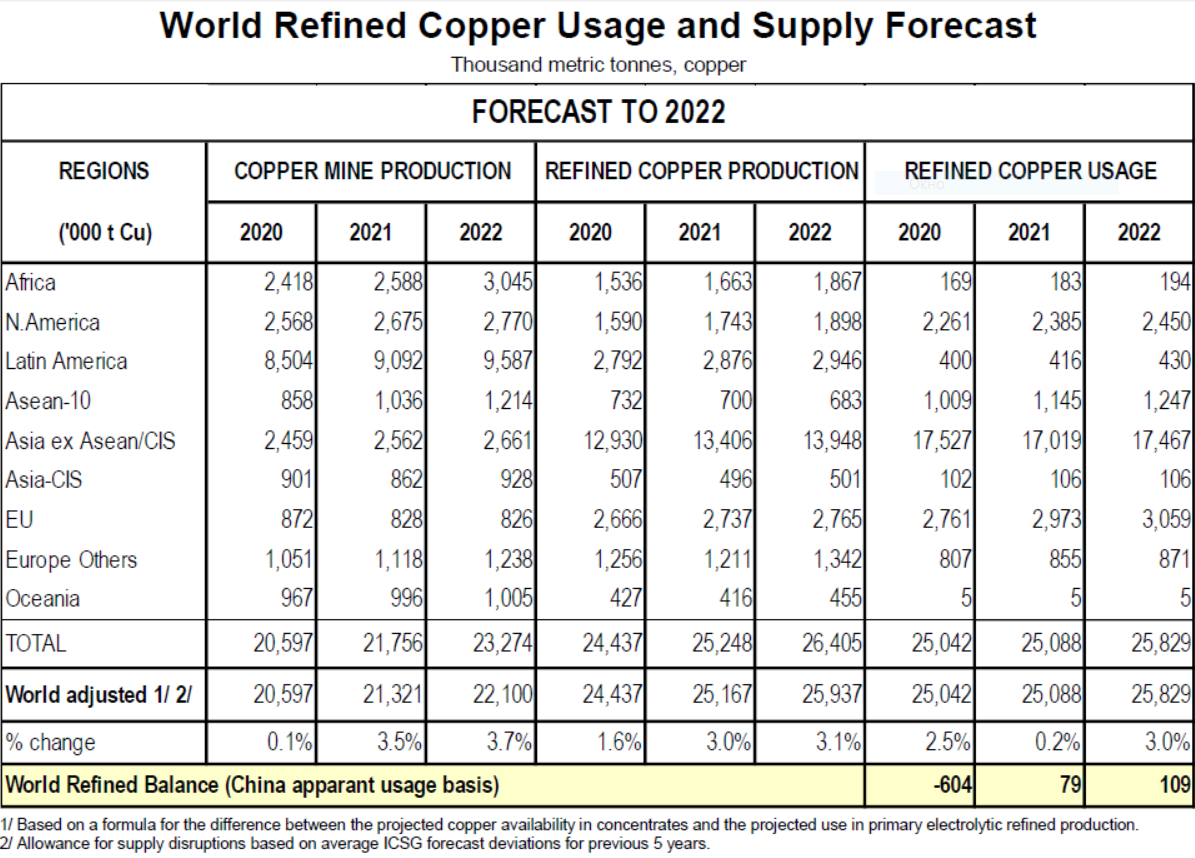
The table shows that the market balance will drift from the deficit of 604,000 metric tons in 2020 to a moderate surplus of 79,000 metric tons this year and 109,000 metric tons in 2022. The consumption part is considered stable this year compared to the last year with a tangible growth next year. The production forecast shows a robust increase in both 2021 and 2022 amid the current favorable price environment.
Intelligent trades!
Aibek Burabayev
INO.com Contributor, Metals
Disclosure: This contributor has no positions in any stocks mentioned in this article. This article is the opinion of the contributor themselves. The above is a matter of opinion provided for general information purposes only and is not intended as investment advice. This contributor is not receiving compensation (other than from INO.com) for their opinion.
By Ino.com – See our Trader Blog, INO TV Free & Market Analysis Alerts
Source: Copper Is On The Verge