
By Ino.com
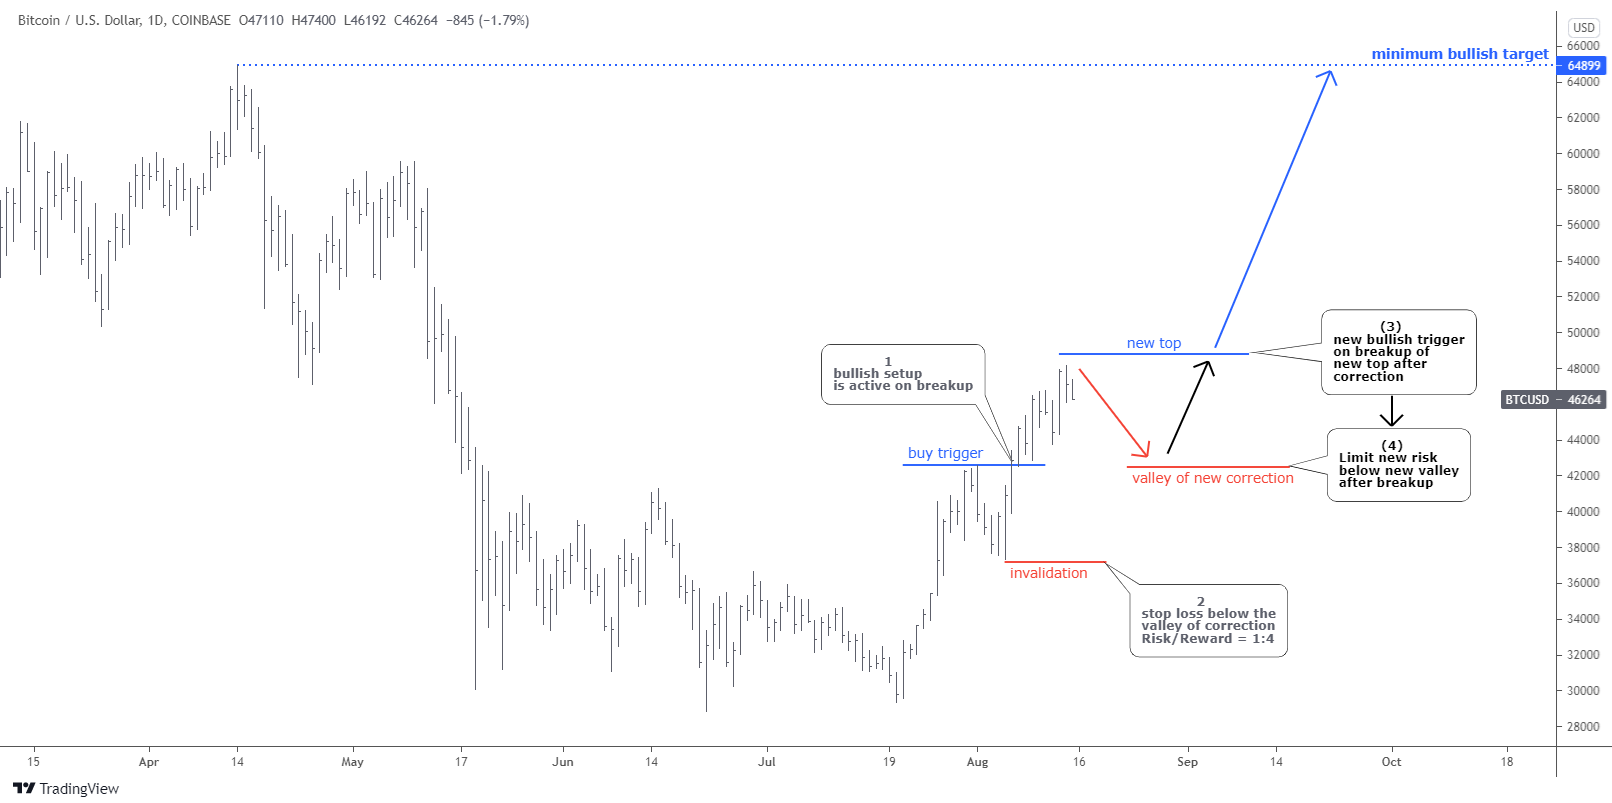
Bitcoin triggered the new buy setup posted last week.
Most readers confirmed that they see the new bullish opportunity in Bitcoin, and the largest part were ready to add or enter the new trade.

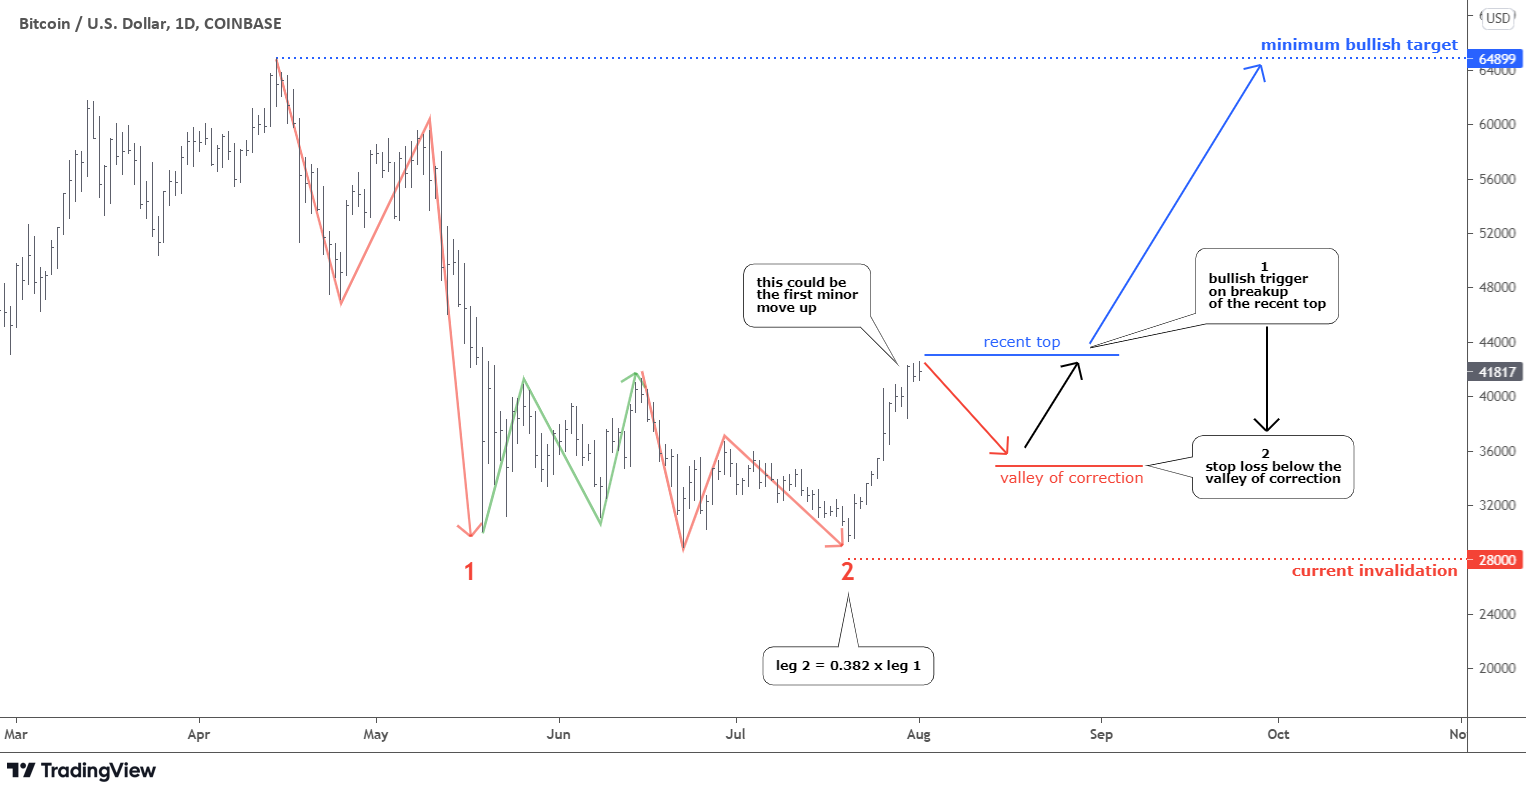
The new buy setup repeated the first trade setup as the setback was not deep again as it only reached the same 38.2% Fibonacci retracement level.
The Friday brought the expected trigger above the previous Saturday’s top of $48,150. The setup is active now and should limit risk below the valley of correction to around $43,900. The risk/reward is good at 1:4, with the same target at the all-time high of $64,899.
Free Reports:
 Get our Weekly Commitment of Traders Reports - See where the biggest traders (Hedge Funds and Commercial Hedgers) are positioned in the futures markets on a weekly basis.
 Download Our Metatrader 4 Indicators – Put Our Free MetaTrader 4 Custom Indicators on your charts when you join our Weekly Newsletter
If you prefer to cut the risk, then it is time to modify the first buy setup. You could move the first stop loss to break even around $42,600. Enjoy!
The flash crash in the gold chart at the start of the day on August 9, 2021, was sharp as it traveled more than $70 in less than 15 minutes.
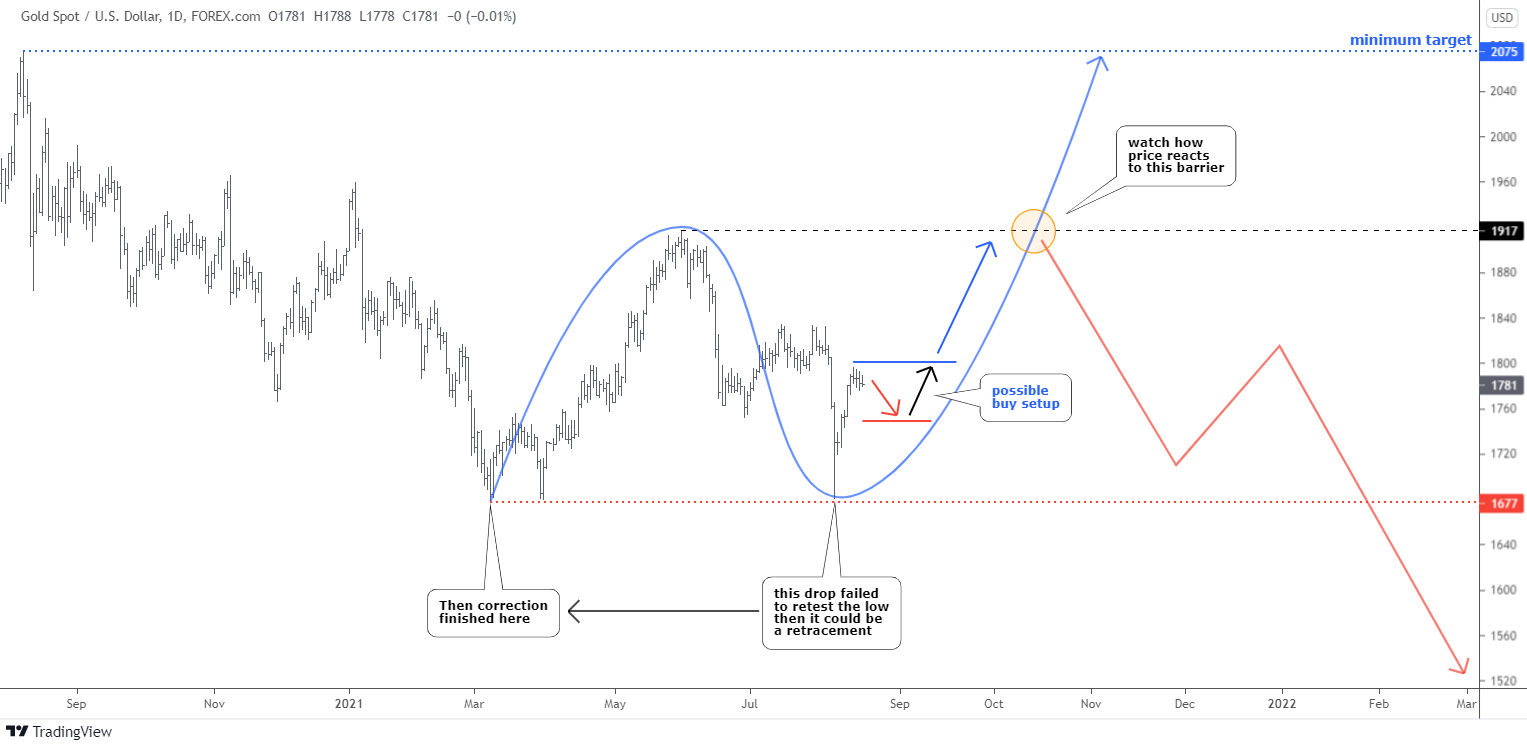
However, it could not retest the valley established this March at $1677. Then, we could consider this low as the finishing point for a big correction that started a year ago from the all-time high of $2075. In this case, the rise of the gold price in March-May to the top of $1917 could be the first move to the upside. The following drop is the retracement of that move.
The price bounced up quite fast to recover after a flash-crash as it reversed all losses from that collapse and eyes the top of the interconnector at $1834. The peak of the first move up at $1917 would act as a strong barrier. Let us see how price reacts to the barrier, as two options could play out.
The bullish scenario implies the breakup of the obstacle and the continuation to the upside to retest the minimum target of $2075 at an all-time high.
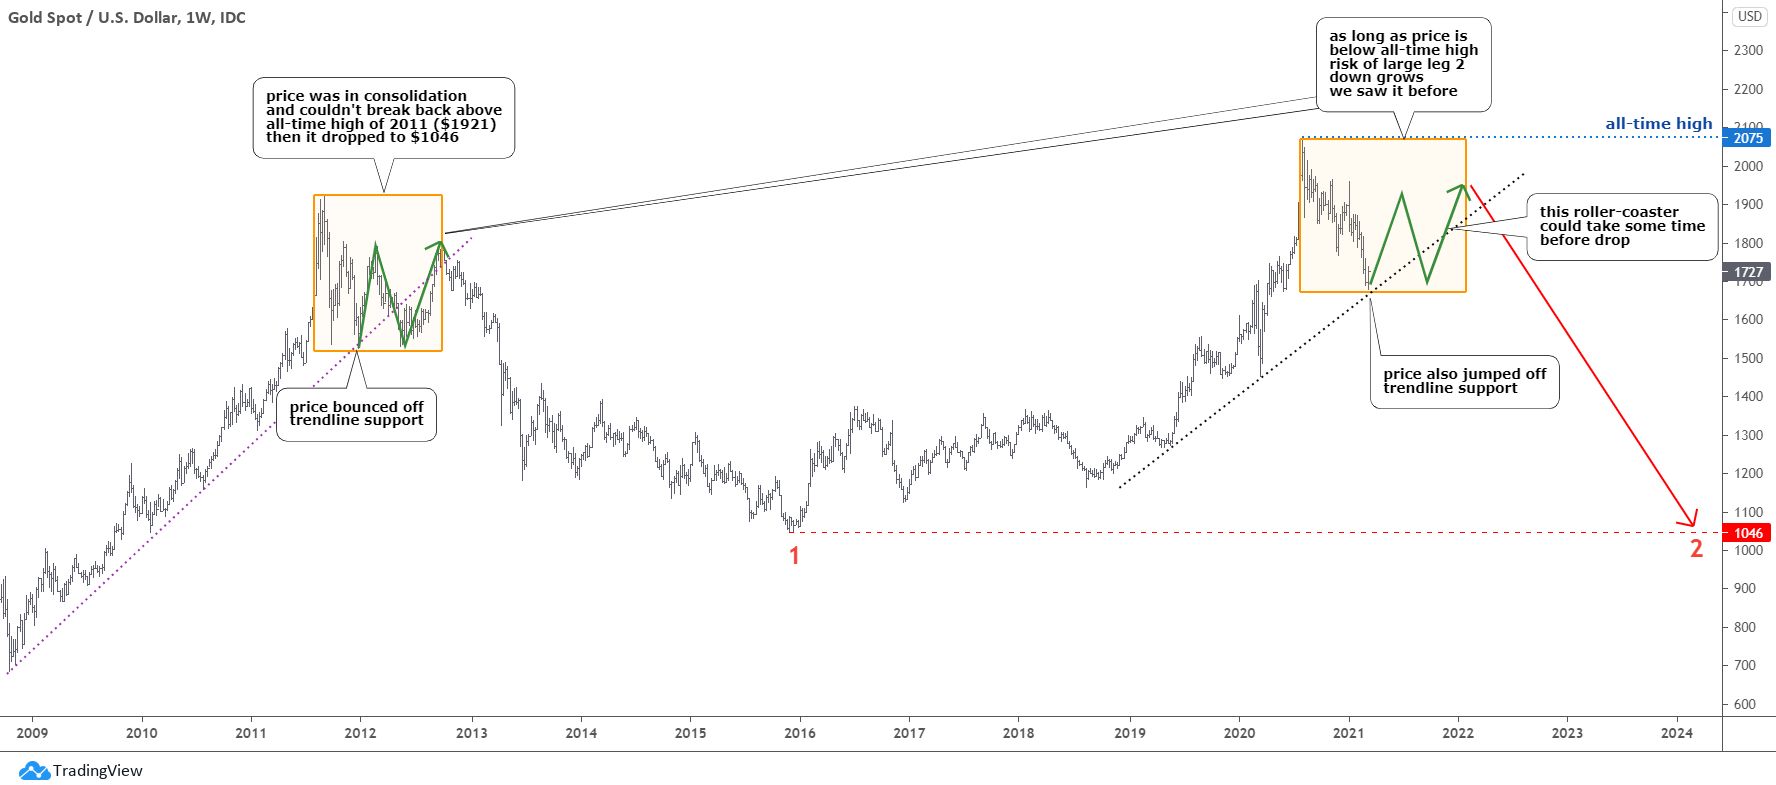
Another path shows the rejection at the barrier. This could build either extension of a large complex correction or, in the worst case – the total reversal to the downside. The latter scenario was posted in the “Wake-Up Call” this March. The price accurately follows that scenario so far, and it could be worrisome for bulls.
We could clearly distinct two minor upside moves already in the 4-hour gold chart (not shown). The last move started at $1718 and probably topped already around $1800 handle. Currently, the market paused as the price shows a sideways correction. It could drop between $1766 (38.2% Fibonacci retracement level) and $1748 (61.8%). If that happens and the price rises above $1800, then the buy setup will be active with a stop loss under the valley of a correction. The target is on the barrier of $1917. In case of a deep 61.8% retracement, the risk-reward will be at 1:2.5. If collapse is only 38.2% (as we saw in Bitcoin), the risk-reward will jump to a decent 1:4.
Intelligent trades!
Aibek Burabayev
INO.com Contributor, Metals
Disclosure: This contributor has no positions in any stocks mentioned in this article. This article is the opinion of the contributor themselves. The above is a matter of opinion provided for general information purposes only and is not intended as investment advice. This contributor is not receiving compensation (other than from INO.com) for their opinion.
By Ino.com – See our Trader Blog, INO TV Free & Market Analysis Alerts
Source: Bitcoin and Gold Update: What’s Next?

- COT Metals Charts: Weekly Speculator Bets led by Copper & Steel Jul 18, 2026
- COT Bonds Charts: Weekly Speculator Bets led by 2-Year, SOFR 3M & 5-Year Bonds Jul 18, 2026
- COT Energy Charts: Weekly Speculator Bets led by Brent Oil & Heating Oil Jul 18, 2026
- COT Soft Commodities Charts: Weekly Speculator Bets led by Wheat, Corn & Soybean Meal Jul 18, 2026
- The Bank of Canada kept its interest rate unchanged. Platinum prices reached a three‑week high Jul 16, 2026
- Stock indices rose after the release of US inflation data. China’s GDP slowed sharply Jul 15, 2026
- GBP/USD Awaits Political News: What Will Happen Next Jul 15, 2026
- USD/JPY Holds at Highs: Pressure Lingers on Yen Jul 14, 2026
- Oil prices jumped 4% amid a new wave of escalation between the US and Iran Jul 13, 2026
- EUR/USD: US Inflation Will Determine Everything Jul 13, 2026