
By Orbex
SPX 500 breaks to new high
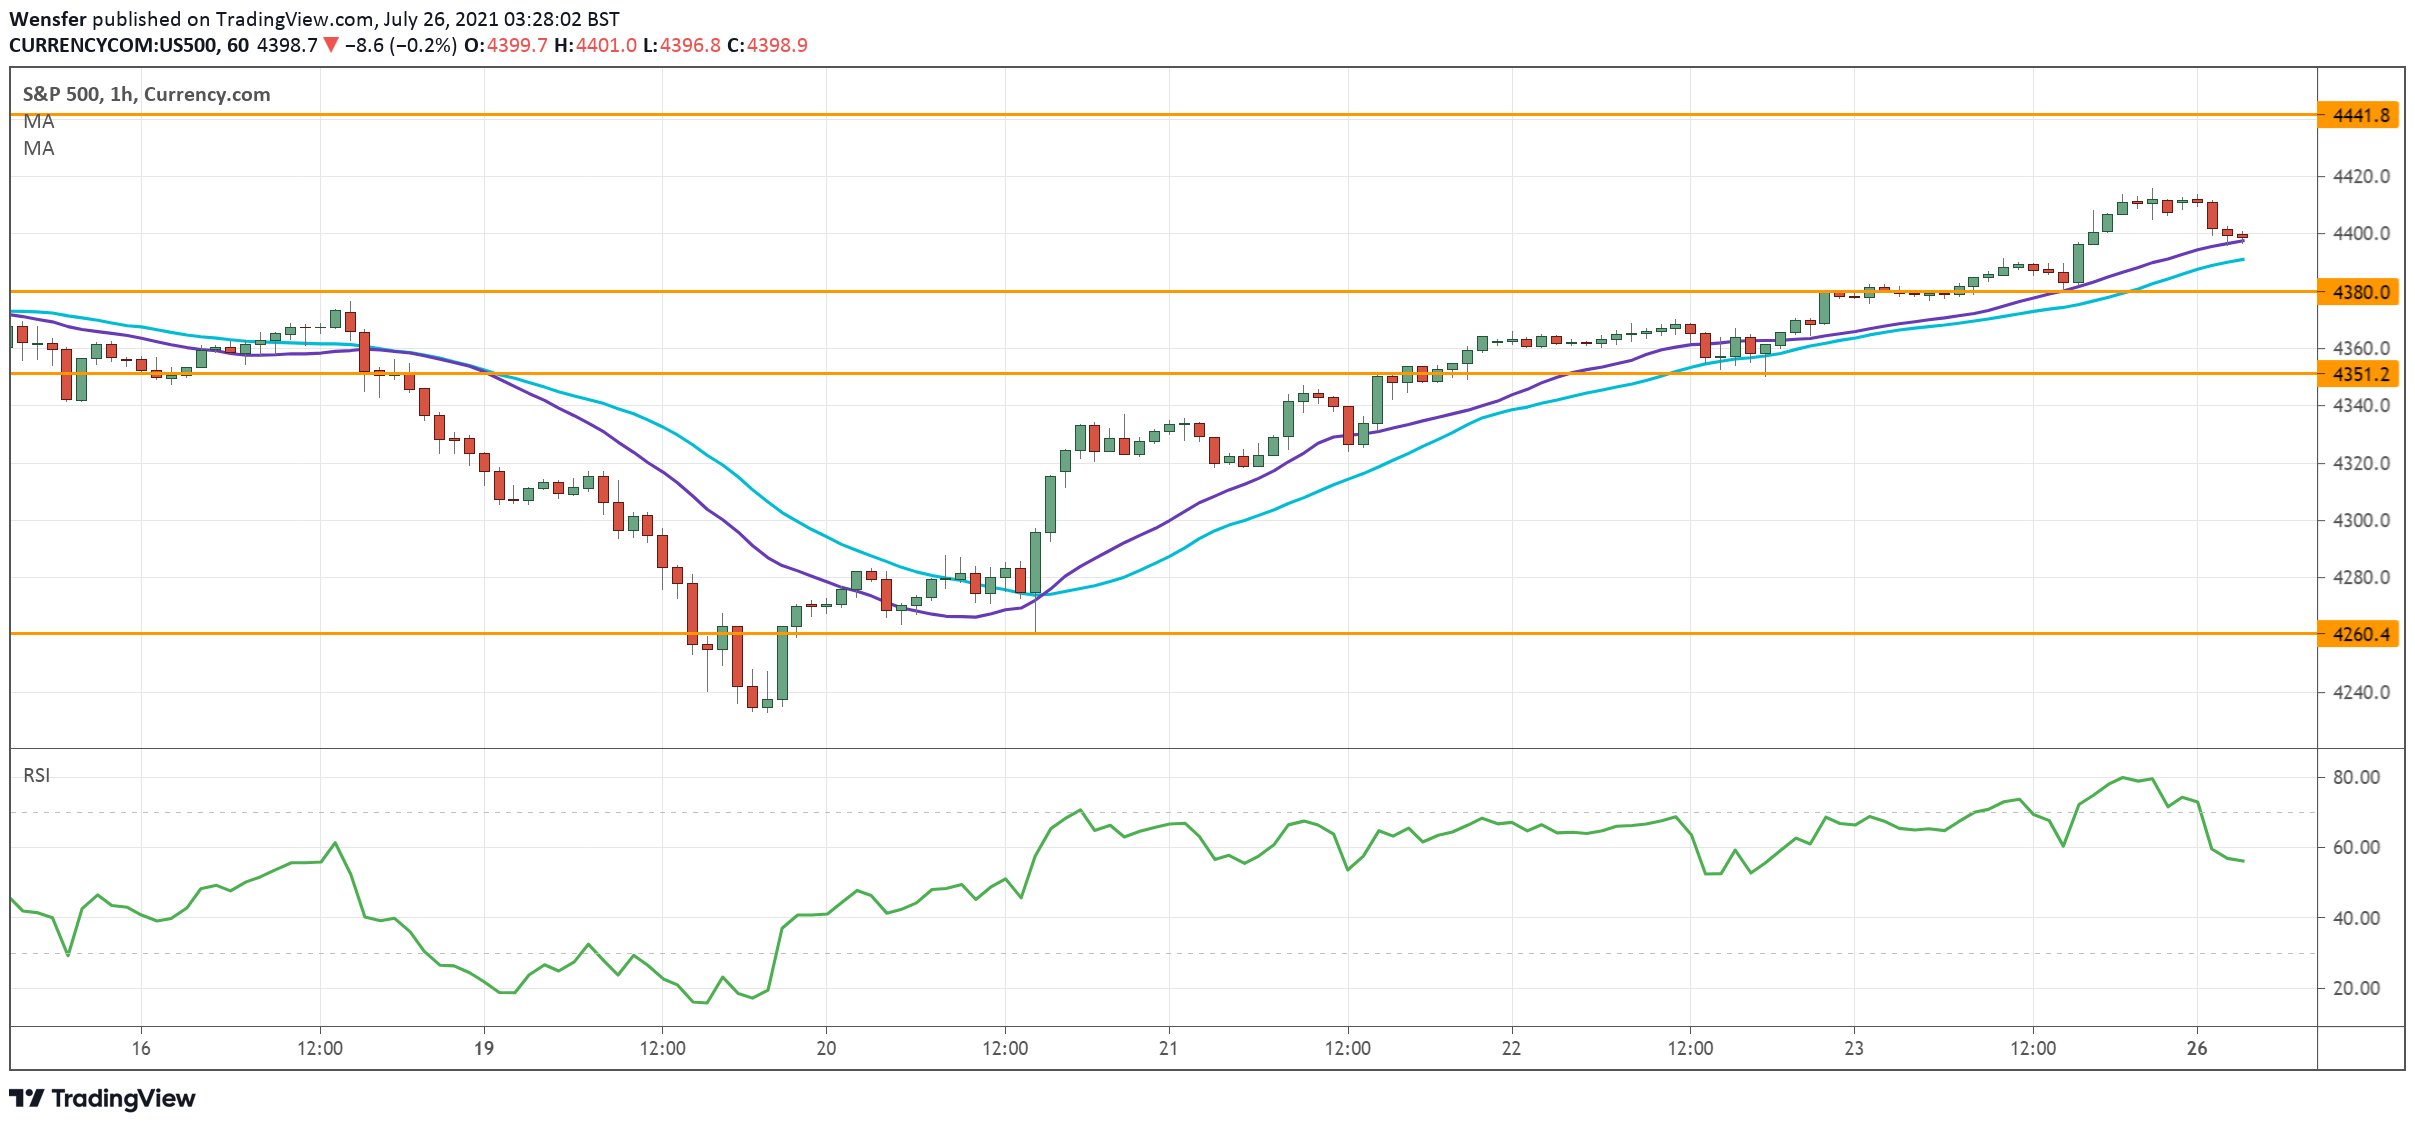
The S&P 500 rose back to its previous high on strong corporate earnings.
The index has met strong bids around 4250, the top range of the late June consolidation. The subsequent surge gave no room for sellers to get a foothold.
An overbought RSI may prompt intraday traders to take profit at the peak (4392). 4380 has been established as fresh support where buyers could be lurking around. Further below, 4350 may provide another layer of support.
On the upside, a bullish breakout would extend the rally towards 4440.
Free Reports:
 Get our Weekly Commitment of Traders Reports - See where the biggest traders (Hedge Funds and Commercial Hedgers) are positioned in the futures markets on a weekly basis.
 Download Our Metatrader 4 Indicators – Put Our Free MetaTrader 4 Custom Indicators on your charts when you join our Weekly Newsletter
USDCAD hovers above support
The Canadian dollar stays muted despite a slight improvement in retail sales in May. The greenback has met stiff selling pressure near February’s high (1.2800).
The sharp drop is likely due to profit-taking after a rally above the resistance of 1.2650 from the daily chart. If longs succeed in holding 1.2500, the sentiment would remain bullish. Failing that, the pair may retreat to 1.2300.
The RSI is rising back to the neutrality area, a sign of buying interest in the demand area. 1.2730 would be the immediate resistance ahead.
EURGBP bounces off demand zone

The pound remains under pressure after lackluster retail sales ex-fuel in June. The pair’s advance beyond 0.8610 has forced sellers to cover their positions.
The price has dropped back to the demand zone at 0.8550 for accumulation.
The RSI has recovered back to the neutral area. A rally above 0.8585 would confirm the bullish bias and rekindle buyers’ enthusiasm.
0.8610 is the next resistance, then a break above 0.8660 may trigger a runaway rally. On the downside, 0.8510 is still key support.
By Orbex

- COT Metals Charts: Speculator Bets led by Silver, Gold & Platinum Mar 7, 2026
- COT Bonds Charts: Speculator Bets led by 10-Year Bonds & Fed Funds Mar 7, 2026
- COT Energy Charts: Speculator Bets led by Brent Oil & Heating Oil Mar 7, 2026
- COT Soft Commodities Charts: Speculator Bets led by Corn & Soybean Meal Mar 7, 2026
- Investors run to safe-haven assets amid Middle East escalation Mar 6, 2026
- EUR/USD Under Pressure: Middle East Risks Outweigh All Else Mar 6, 2026
- Bitcoin shows resilience to Middle East events. Oil market stabilizes Mar 5, 2026
- GBP/USD: Market Not Expecting BoE Rate Cut in March Mar 5, 2026
- Brent headed for $100? Mar 4, 2026
- Global stock indices continue sell-off due to Middle East conflict Mar 4, 2026