
Article By RoboForex.com
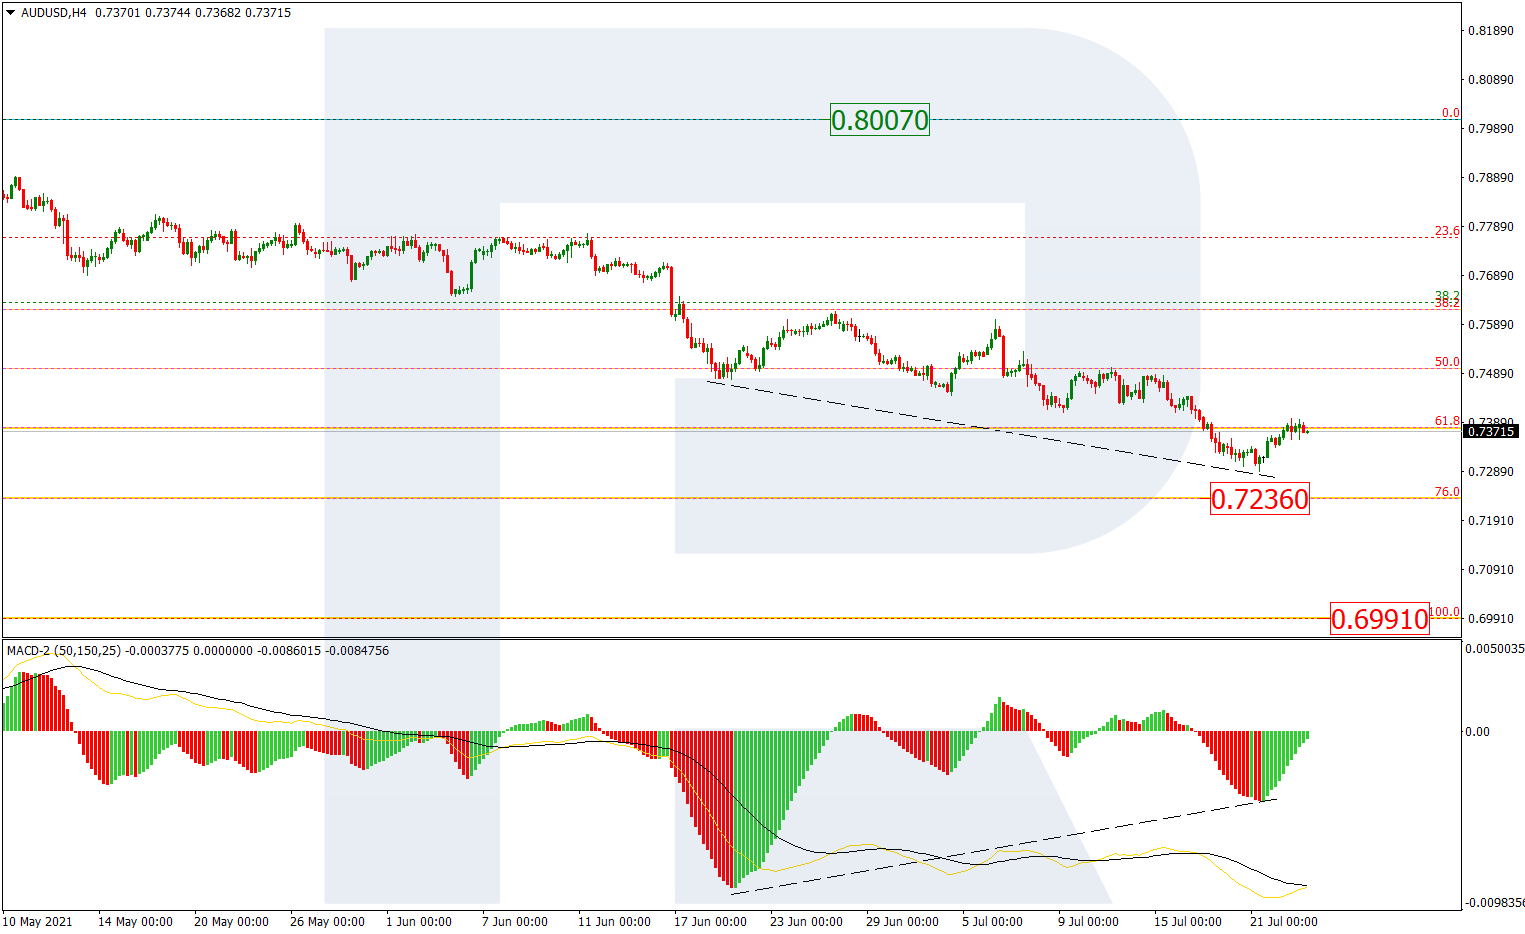
AUDUSD, “Australian Dollar vs US Dollar”
In the H4 chart, after breaking 61.8% fibo at 0.7379, the downtrend has failed to reach 76.0% fibo at 0.7236. At the same time, we can see divergence on MACD, which may force the asset to start a pullback to the upside. However, this ascending movement is not expected to reach the high at 0.8007. In the future, this pullback may be followed by another descending wave to reach the fractal support at 0.6991.

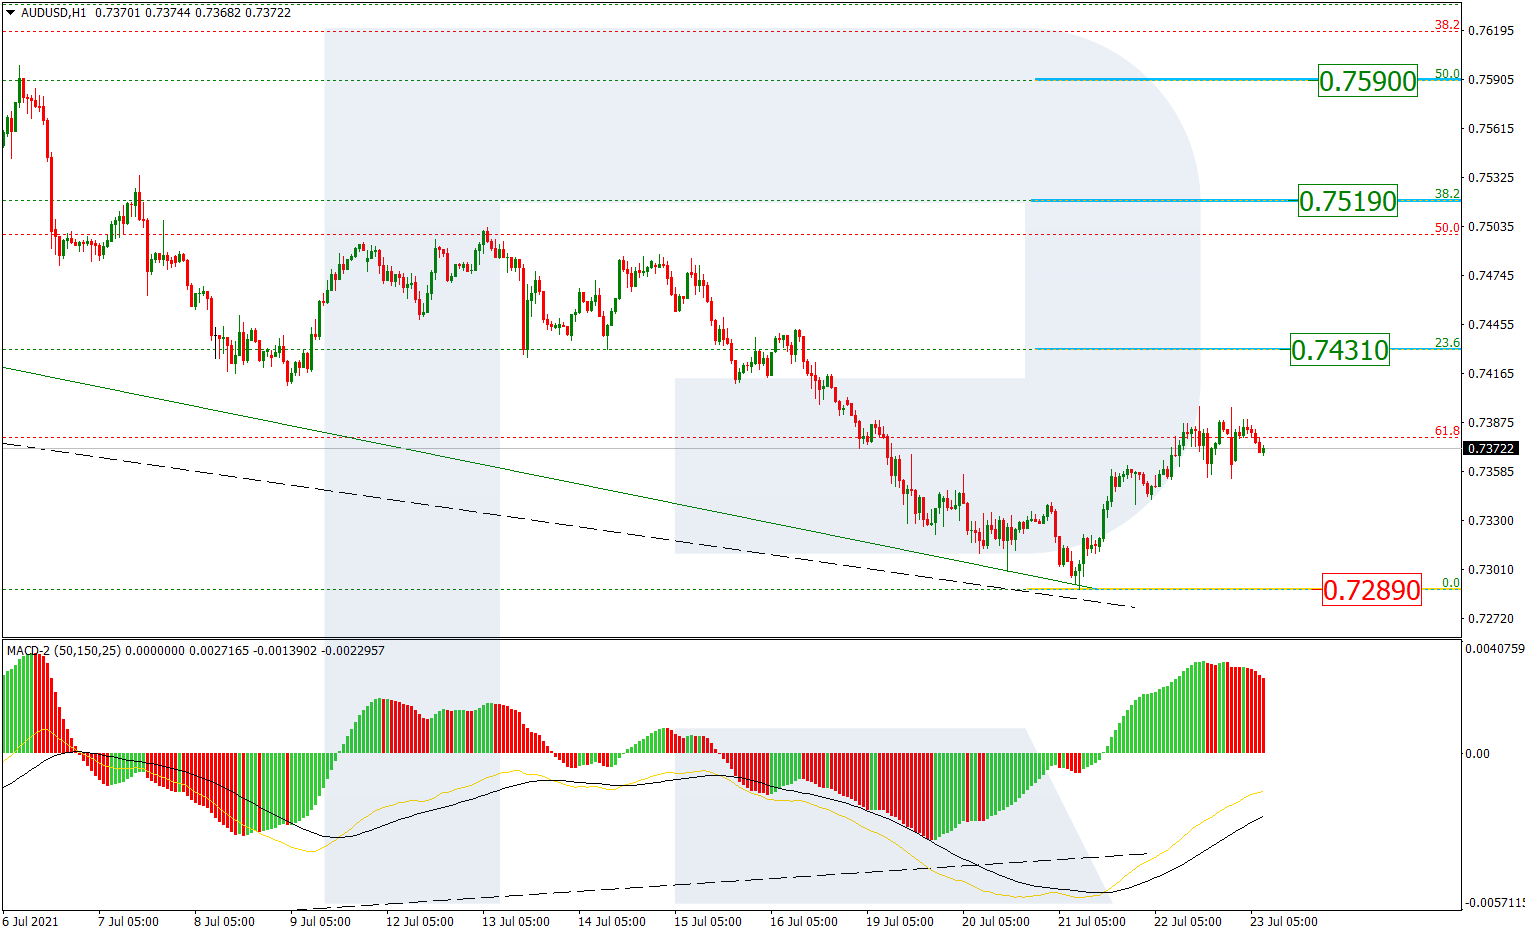
The H1 chart of AUDUSD shows potential correctional targets after convergence on MACD, which are 23.6%, 38.2%, and 50.0% fibo at 0.7431, 0.7519, and 0.7590 respectively. A breakout of the low at 0.7289 will result in a further downtrend.
Free Reports:
 Sign Up for Our Stock Market Newsletter – Get updated on News, Charts & Rankings of Public Companies when you join our Stocks Newsletter
 Get our Weekly Commitment of Traders Reports - See where the biggest traders (Hedge Funds and Commercial Hedgers) are positioned in the futures markets on a weekly basis.
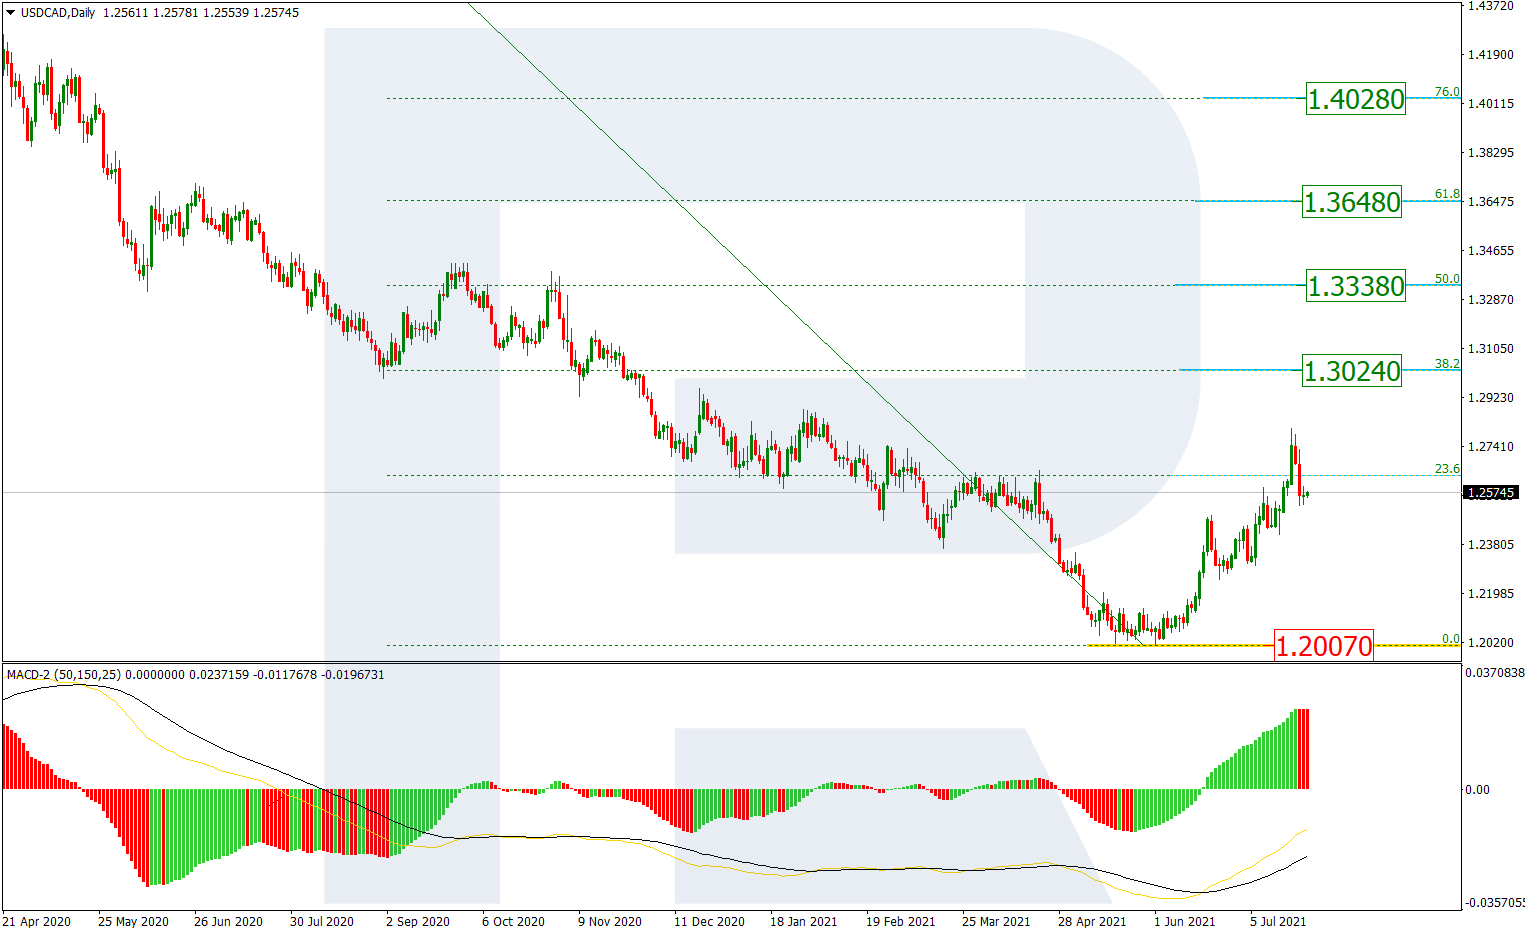
USDCAD, “US Dollar vs Canadian Dollar”
As we can see in the daily chart, after finishing the first ascending wave at 23.6% fibo, USDCAD is correcting and may later resume its mid-term uptrend towards 38.2%, 50.0%, 61.8%, and 76.0% fibo at 1.3024, 1.3338, 1.3648, and 1.4028 respectively. The key support remains at the low at 1.2007.
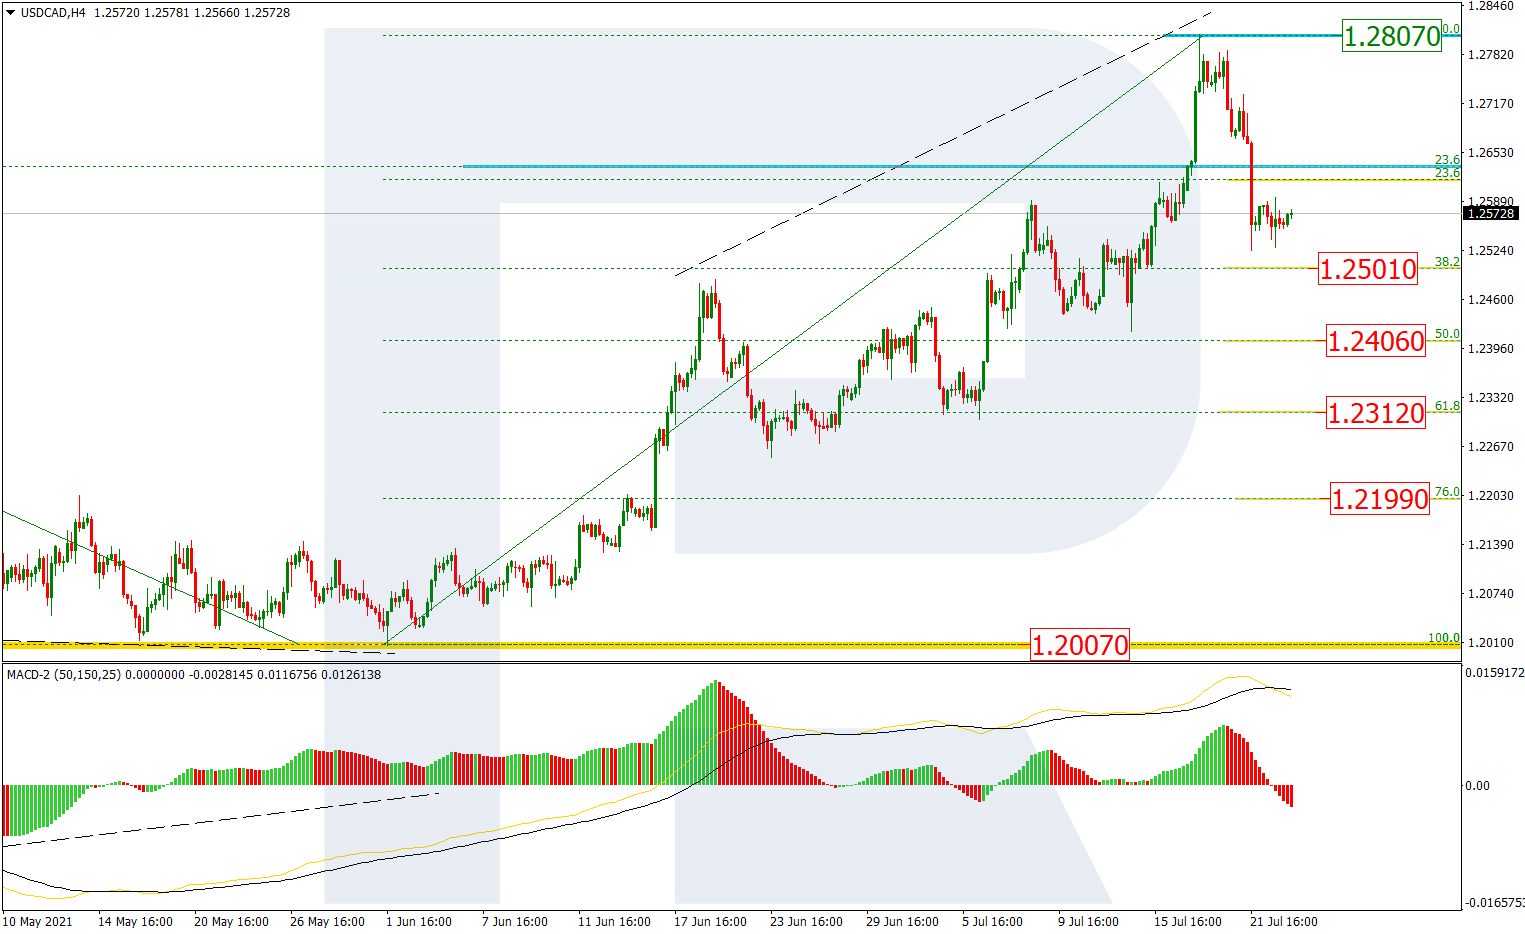
The H4 chart shows a descending correction after divergence on MACD, which has already broken 23.6% fibo and may later continue towards 38.2%, 50.0%, 61.8%, and 76.0% fibo at 1.2501, 1.2406, 1.3212, and 1.21999 respectively. The local resistance is at 1.2807.
Article By RoboForex.com
Attention!
Forecasts presented in this section only reflect the author’s private opinion and should not be considered as guidance for trading. RoboForex LP bears no responsibility for trading results based on trading recommendations described in these analytical reviews.

- COT Metals Charts: Speculator Bets led by Silver, Gold & Platinum Mar 7, 2026
- COT Bonds Charts: Speculator Bets led by 10-Year Bonds & Fed Funds Mar 7, 2026
- COT Energy Charts: Speculator Bets led by Brent Oil & Heating Oil Mar 7, 2026
- COT Soft Commodities Charts: Speculator Bets led by Corn & Soybean Meal Mar 7, 2026
- Investors run to safe-haven assets amid Middle East escalation Mar 6, 2026
- EUR/USD Under Pressure: Middle East Risks Outweigh All Else Mar 6, 2026
- Bitcoin shows resilience to Middle East events. Oil market stabilizes Mar 5, 2026
- GBP/USD: Market Not Expecting BoE Rate Cut in March Mar 5, 2026
- Brent headed for $100? Mar 4, 2026
- Global stock indices continue sell-off due to Middle East conflict Mar 4, 2026