Article By RoboForex.com
XAUUSD, “Gold vs US Dollar”
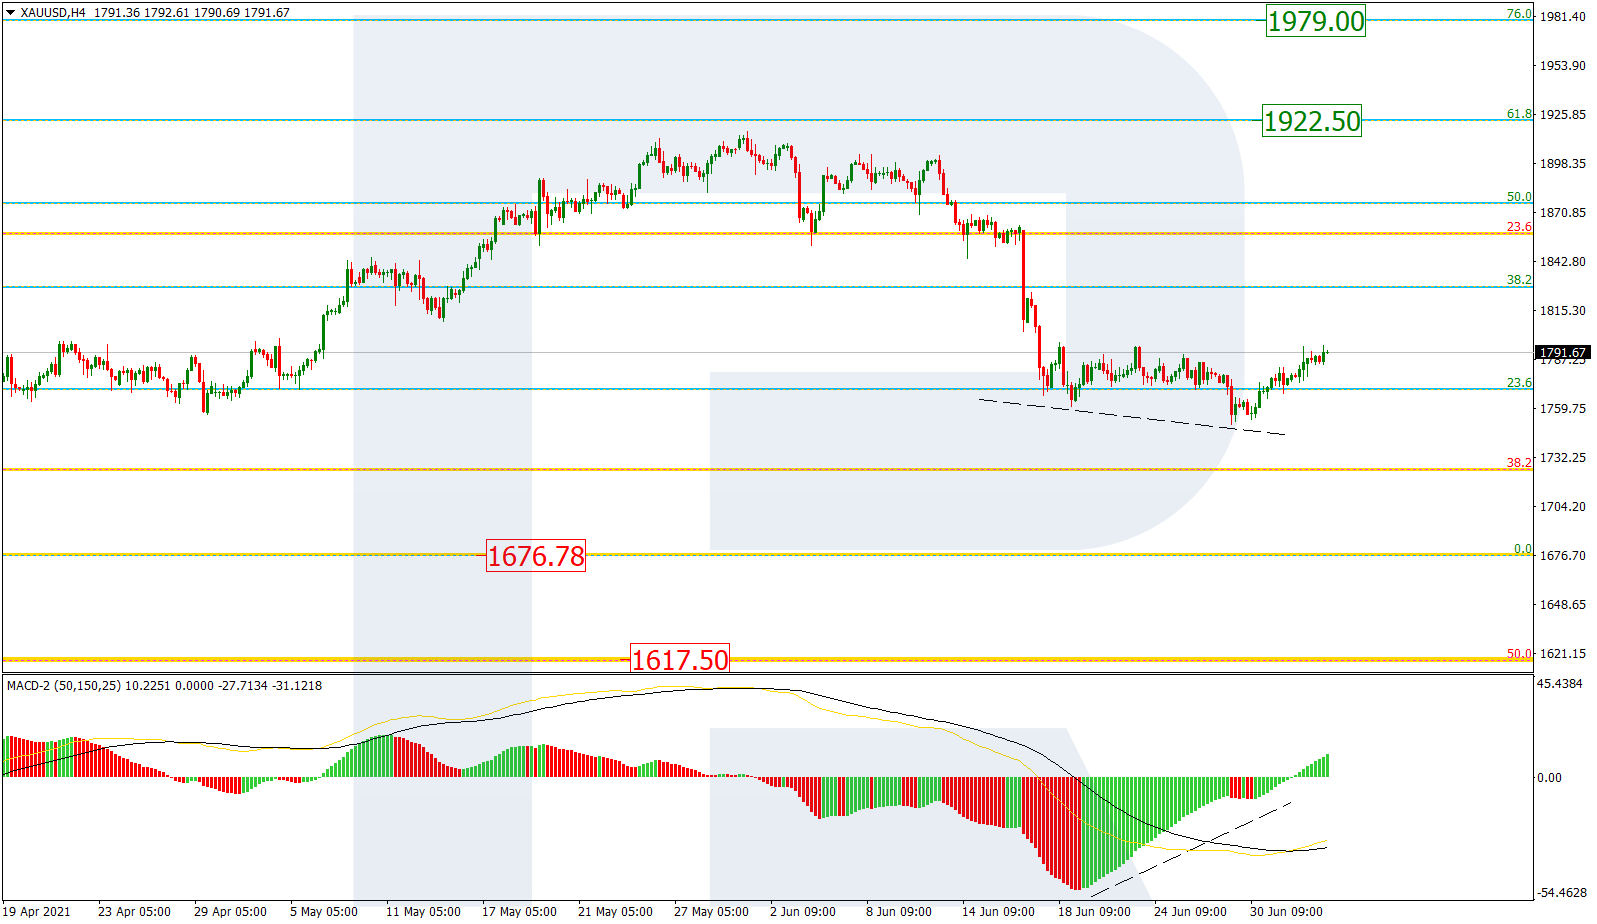
As we can see in the H4 chart, XAUUSD is trading upwards after convergence on MACD and this growth may be considered as a correction after a strong descending wave. However, this correctional growth may transform into another wave to the upside. At the same time, if the growth is over, the pair may resume falling to break the low at 1676.78 and then continue trading downwards to reach the long-term 50.0% fibo at 1617.50. On the other hand, if the asset continues growing steadily and breaks the resistance at 1916.52, it may lead to a further rising movement towards the mid-term targets, which are 61.8% and 76.0% fibo at 1922.95 and 1979.00 respectively.

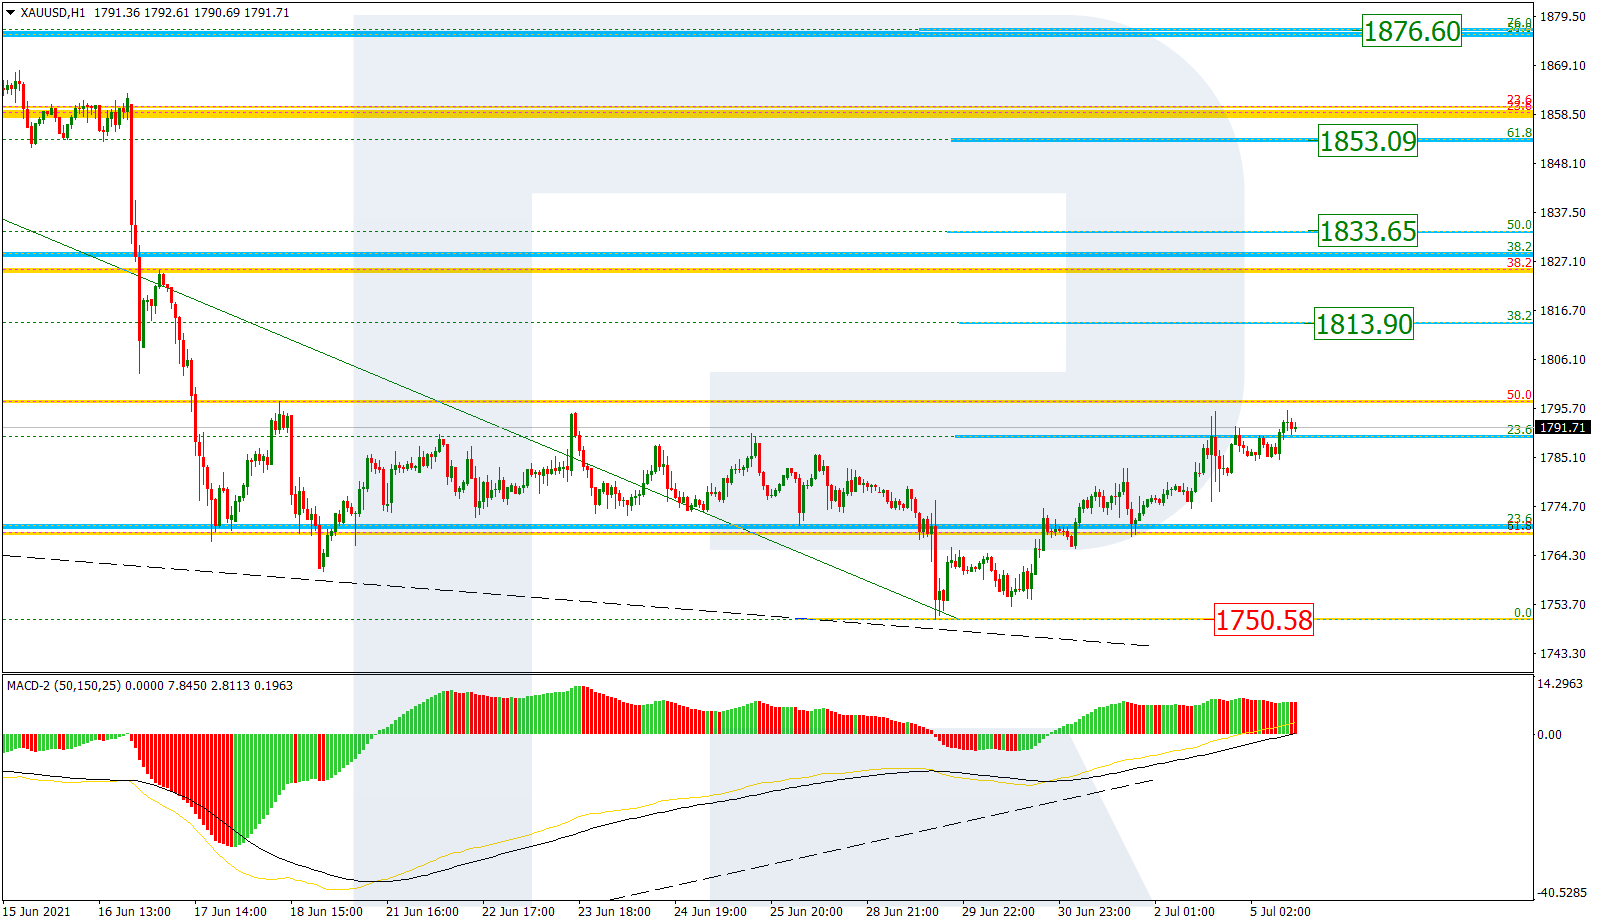
The H1 chart shows a more detailed structure of the current correctional uptrend and its targets. After reaching 23.6% fibo, the pair is testing it and trying to fix above. The next upside targets may be 38.2%, 50.0%, 61.8%, and 76.0% fibo at 1813.90, 1833.65, 1853.09, and 1876.60 respectively. The support is the low at 1750.58. If the price breaks this level, the asset will complete the correction and resume trading downwards.
Free Reports:
 Sign Up for Our Stock Market Newsletter – Get updated on News, Charts & Rankings of Public Companies when you join our Stocks Newsletter
 Get our Weekly Commitment of Traders Reports - See where the biggest traders (Hedge Funds and Commercial Hedgers) are positioned in the futures markets on a weekly basis.
USDCHF, “US Dollar vs Swiss Franc”
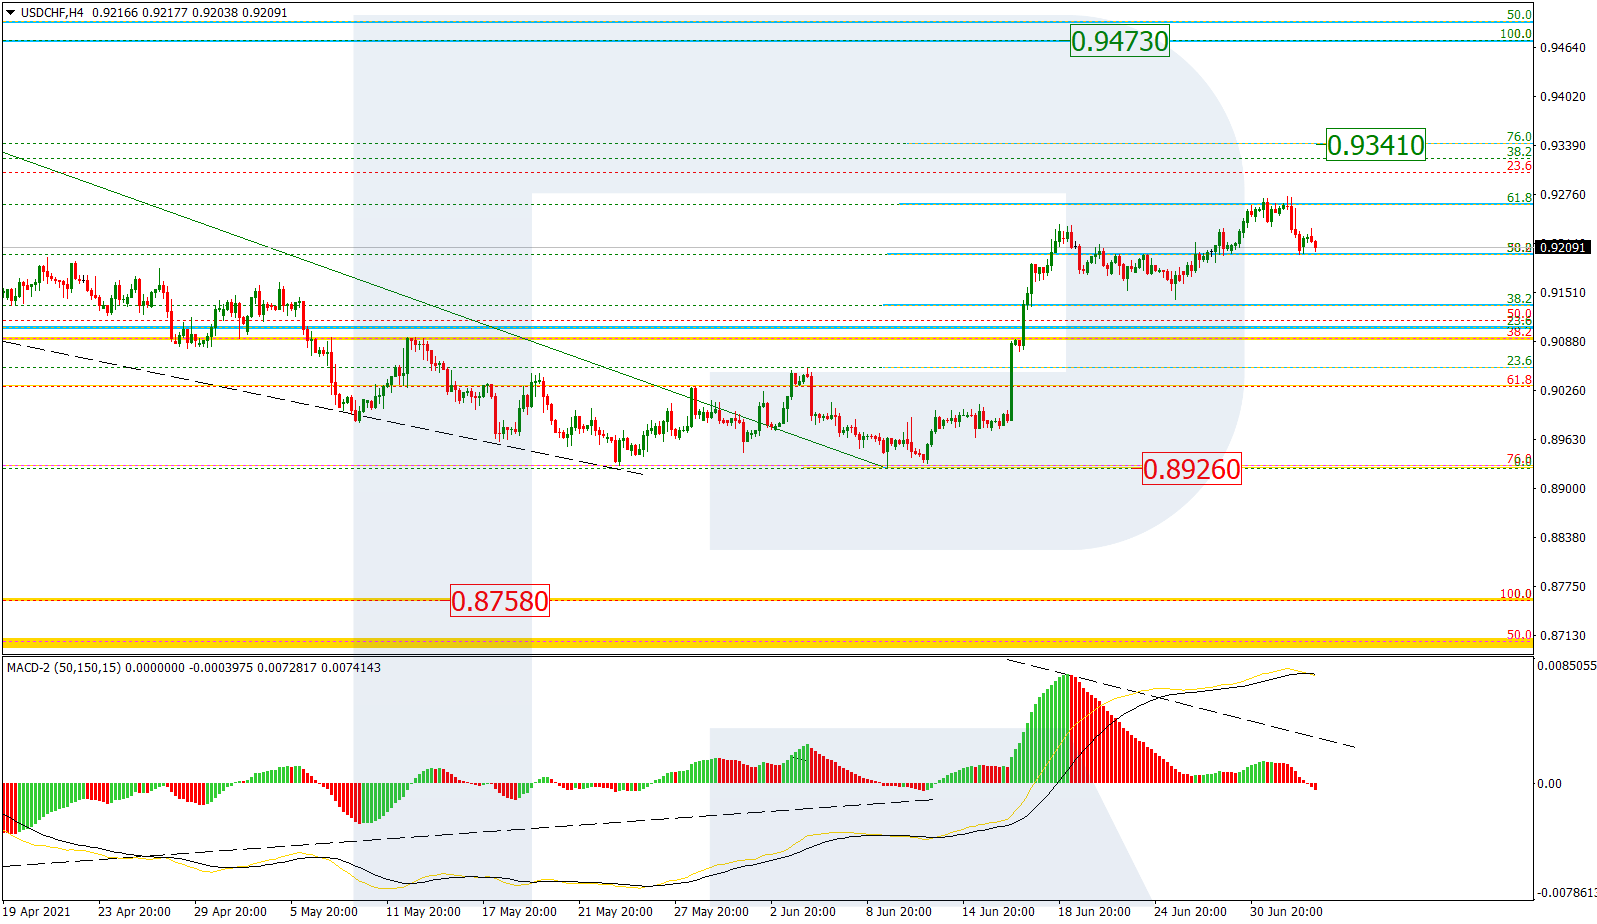
As we can see in the H4 chart, there was convergence on MACD, after which the asset completed a rising movement to reach 61.8% fibo that was followed by divergence. At the moment, the pair is getting ready for a pullback. If this pullback doesn’t transform into a new decline towards the low at 0.8926, then it may be followed by another rising impulse to reach 76.0% fibo and the high at 0.9341 and 0.9473 respectively.
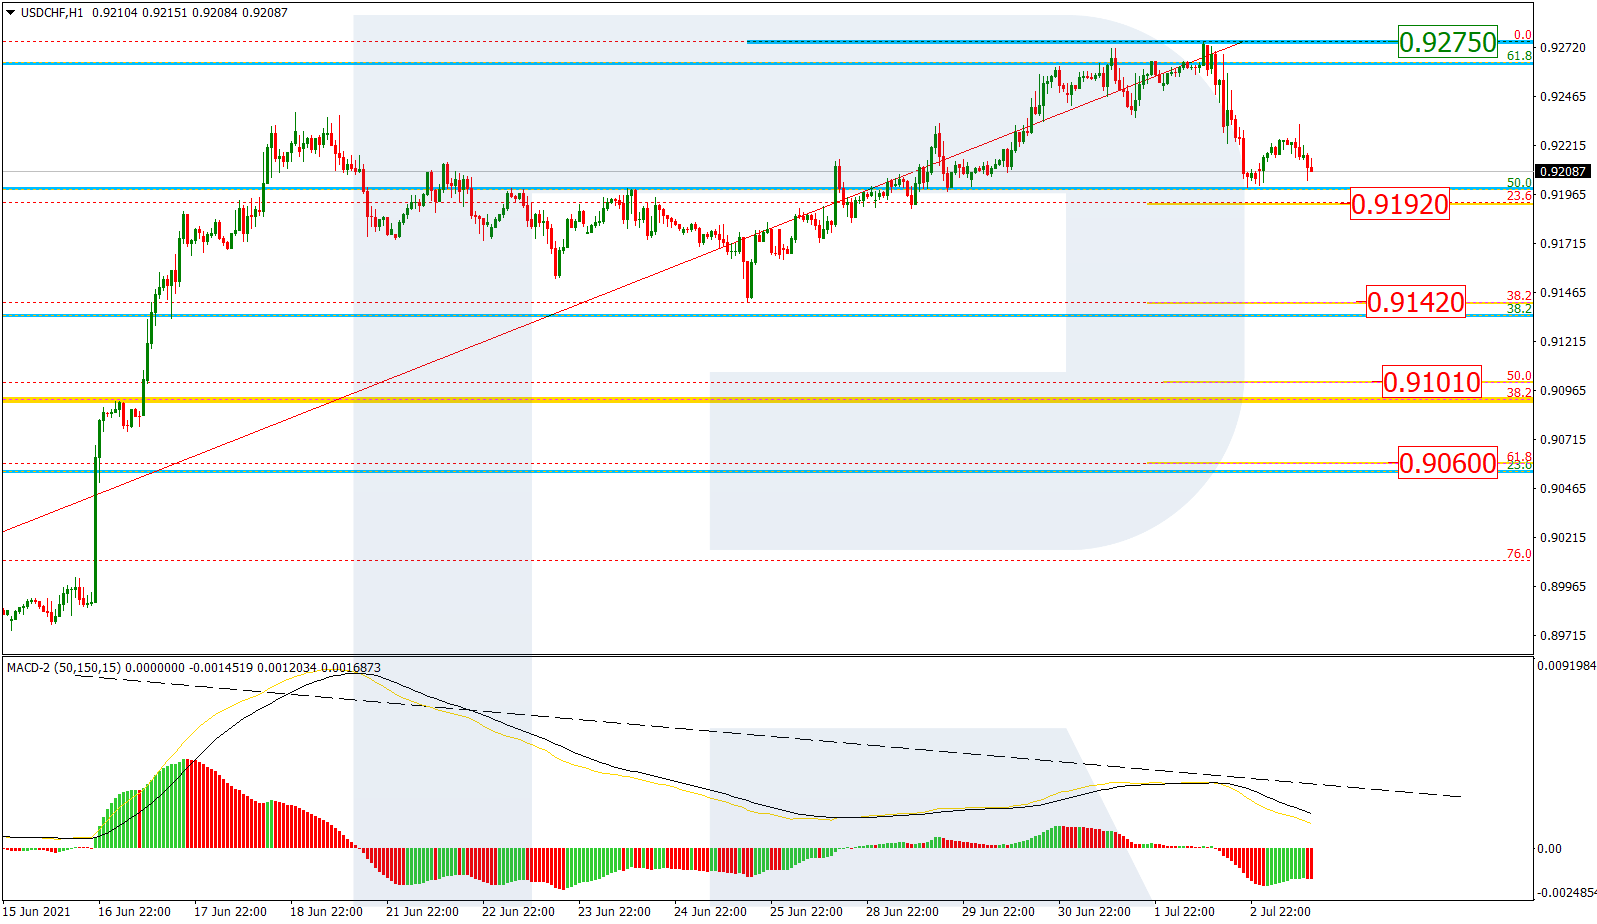
The H1 chart shows a more detailed structure of the current decline after divergence on MACD, which is approaching 23.6% fibo at 0.9192. After breaking it, USDCHF may continue falling to reach 38.2%, 50.0%, and 61.8% fibo at 0.9142, 0.9101, and 0.9060 respectively. The resistance is the high at 0.9275.
Article By RoboForex.com
Attention!
Forecasts presented in this section only reflect the author’s private opinion and should not be considered as guidance for trading. RoboForex LP bears no responsibility for trading results based on trading recommendations described in these analytical reviews.

- The US Tech sector hit by sell‑off. Oil prices decline on renewed negotiations Jul 28, 2026
- Gold Declines, Focus on Fed and Falling Oil Prices Jul 28, 2026
- This week will be one of the most crowded for central‑bank meetings Jul 27, 2026
- EUR/USD Ahead of a Key Week: Holding Near Lows Jul 27, 2026
- COT Metals Charts: Weekly Speculator Changes led by Copper Jul 26, 2026
- COT Bonds Charts: Speculator Bets led by SOFR 3-Months & 5-Year Bonds Jul 26, 2026
- COT Energy Charts: Weekly Speculator Bets led by WTI Crude & Natural Gas Jul 26, 2026
- COT Soft Commodities Charts: Weekly Speculator Bets led by Corn & Soybeans Jul 26, 2026
- The US introduces new import tariffs for 60 countries. Brent crude surpasses $100 per barrel Jul 24, 2026
- USD/JPY Breaks Records: Nothing Slows the Yen’s Decline Jul 24, 2026