The Dow Jones 30 stock market index fell 300 points as global markets faltered on worries regarding the economic recovery.
Many countries are dealing with a rebound in coronavirus cases, with Japan declaring a state of emergency weeks before the Tokyo Olympics.
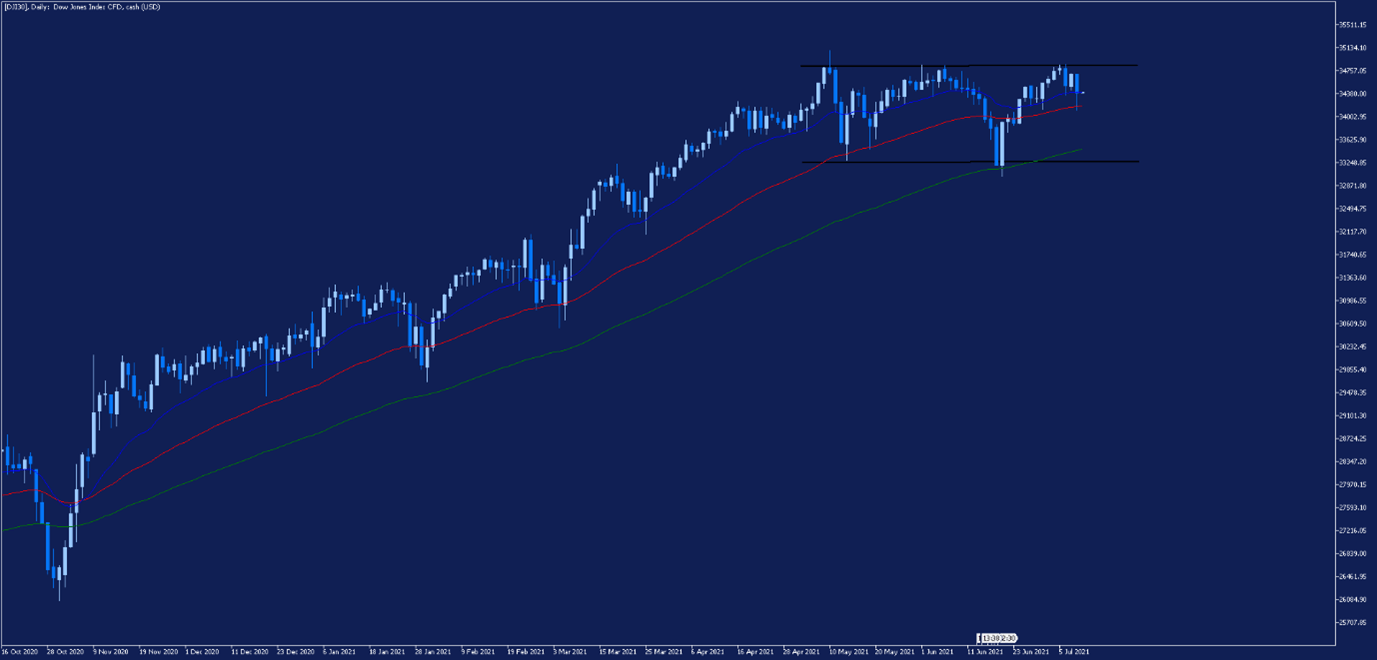
The Dow topped out at historical resistance from a long-term consolidation pattern, as highlighted between the two black horizontal lines in the chart below.
 Source: Admirals MetaTrader 5, DJI30, Daily – Data range: from Mar 16, 2020, to Jul 8, 2021, performed on Jul 8, 2021, at 8:30 pm GMT. Please note: Past performance is not a reliable indicator of future results.
Evolution in the last 5 years:
- 2020: 7.09%
- 2019: 22.66%
- 2018: -5.46%
- 2017: 24.76%
- 2016: 12.74%
The daily price chart above of the DJI 30 shows a clear consolidation developed after a long-term uptrend. So far, price has been respecting and trading in between the upper resistance and lower support.
If the price can break above the top of the resistance and consolidation pattern, it will be a clear sign that buyers are taking control and could lead to higher prices so it’s certainly one to watch!
Did you know that you can use the Trading Central Technical Ideas Lookup indicator to find actionable trading ideas on thousands of different markets?
Start your free download by clicking on the banner below:
INFORMATION ABOUT ANALYTICAL MATERIALS:
The given data provides additional information regarding all analysis, estimates, prognosis, forecasts, market reviews, weekly outlooks or other similar assessments or information (hereinafter “Analysis”) published on the websites of Admiral Markets investment firms operating under the Admiral Markets trademark (hereinafter “Admiral Markets”) Before making any investment decisions please pay close attention to the following:
- This is a marketing communication. The content is published for informative purposes only and is in no way to be construed as investment advice or recommendation. It has not been prepared in accordance with legal requirements designed to promote the independence of investment research, and that it is not subject to any prohibition on dealing ahead of the dissemination of investment research.
- Any investment decision is made by each client alone whereas Admiral Markets shall not be responsible for any loss or damage arising from any such decision, whether or not based on the content.
- With view to protecting the interests of our clients and the objectivity of the Analysis, Admiral Markets has established relevant internal procedures for prevention and management of conflicts of interest.
- The Analysis is prepared by an independent analyst, Jitan Solanki (analyst), (hereinafter “Author”) based on their personal estimations.
- Whilst every reasonable effort is taken to ensure that all sources of the content are reliable and that all information is presented, as much as possible, in an understandable, timely, precise and complete manner, Admiral Markets does not guarantee the accuracy or completeness of any information contained within the Analysis.
- Any kind of past or modeled performance of financial instruments indicated within the content should not be construed as an express or implied promise, guarantee or implication by Admiral Markets for any future performance. The value of the financial instrument may both increase and decrease and the preservation of the asset value is not guaranteed.
- Leveraged products (including contracts for difference) are speculative in nature and may result in losses or profit. Before you start trading, please ensure that you fully understand the risks involved.

