
At the start of a new week, we continue with our review in relation to the development of the main instruments during the first half of the year. In our first analysis of the month, we commented on the good performance of both European and U.S. indices and last week we analysed the recovery of the dollar against the main currency pairs. In today’s analysis, we will see how gold and Brent have behaved over the same period of time.
In our latest analysis with respect to gold, we have commented on how it has been hurt due to the recovery of the dollar during the last months, after rising inflation in the United States before the rumours of a possible tapering by the FED leading this precious metal to fight for its important level of support.
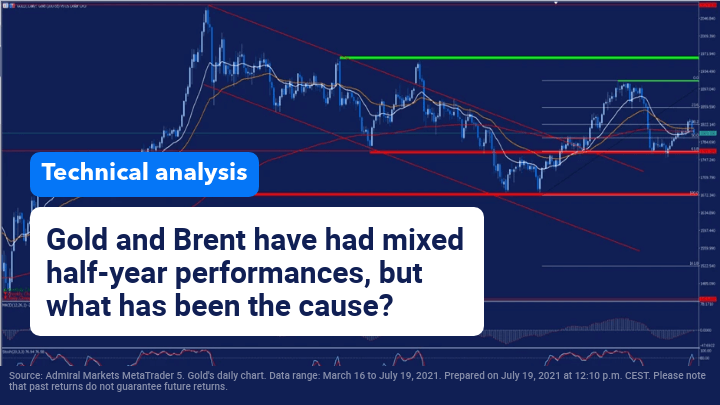
This situation has caused gold to lose 7% during the first half of the year, thus endangering the bullish structure that had been following, after confirming the formation of a triple floor in the lower red band at the end of last March, where a new bullish impulse began that led it to break up the bearish channel that had been following since its historical highs.
This break also caused a triple cross of bullish averages that supported gold in its new trend, in search of its main resistance level represented by the green band. However, after recent events, including the increase in inflation in the United States, gold was forced to retreat strongly to the 61.8% Fibonacci retracement level after breaking several support levels.
Free Reports:
 Sign Up for Our Stock Market Newsletter – Get updated on News, Charts & Rankings of Public Companies when you join our Stocks Newsletter
 Get our Weekly Commitment of Traders Reports - See where the biggest traders (Hedge Funds and Commercial Hedgers) are positioned in the futures markets on a weekly basis.
Although the price temporarily managed to break this level, gold finally managed to make a upward rebound after making a pullback at lower time frames, resurfacing again to $1,834 per ounce.
Currently, the price is struggling to maintain its important support level in the coincident zone of its average of 200 sessions and the psychological level of $1,800 per ounce. It is vitally important that gold manages to maintain this support level if it wants to continue with the rises as a loss of this level could bring the price back to the upper red support band. The loss of this zone would open the door to a further pullback to the annual lows in the lower red strip, thus losing everything gained from this latest upward momentum.
 Source: Admiral Markets MetaTrader 5. Gold’s daily chart. Data range: March 16 to July 19, 2021. Prepared on July 19, 2021 at 12:10 p.m. CEST. Please note that past returns do not guarantee future returns.
Evolution in the last 5 years:
- 2020: 21,86%
- 2019: 15,45%
- 2018: -3,22%
- 2017: 12,75%
- 2016: 10,12%
On the contrary, and in the case of Brent, we can see that despite the rebound of the dollar during the first half of the year, this is being a good year for crude oil, since during the first half the price of a barrel of Brent has recovered by more than 45%.
This can be explained by the positive future prospects that exist around this important raw material thanks to the improvement of the pandemic situation at the global level and the reopening of economies due to the advanced vaccination process. In addition, these prospects were reinforced after OPEC published an optimistic report regarding its future expectations for 2022 in which it forecasts a strong rebound in consumption with a possible increase in production of 1.4 million barrels per day by each member of the group.
On July 2, in our daily analysis, we commented that OPEC and its allies were holding a meeting in view of the possible increase in production over the next few months. After two tough weeks of negotiations, it seems that an agreement has finally been reached in which production will gradually increase at the rate of 400,000 barrels per day until reaching 2 million barrels next December, thus dispelling the uncertainty for the future. This meeting was very important, as an insufficient agreement or an agreement too modest, could harm the price in the short term by cutting the euphoria of the markets in the face of the increase in demand since this could be insufficient.
Technically speaking, if we look at the weekly chart, we can see how during this month of July, the price of a barrel of Brent has fallen by around 4.65%, which has taken the price back to the area of $72 per barrel in its previous support/resistance level after bouncing down from its long-term downtrend line.
It is important to see if the price is able to maintain this level of support in the face of a possible new rally that may lead it to face again its current level of resistance at the long-term downtrend line, since a possible breakout could lead the price to experience a strong upward momentum to $80 per barrel or even to levels close to $87.
On the contrary, we can observe that the price is trading far from its moving averages and presents a strong overbought in its stochastic indicator, so we must also be attentive to a possible correction.
 Source: Admiral Markets MetaTrader 5. Weekly brent chart. Data range: January 18, 2015 to July 19, 2021. Prepared on July 19, 2021 at 12:10 p.m. CEST. Please note that past returns do not guarantee future returns.
Evolution in the last 5 years:
- 2020: -21,52%
- 2019: 22,68%
- 2018: -19,55%
- 2017: 17,69%
- 2016: 52,41%
With Admirals’ Trade.MT5 account, you can trade Contracts for Differences (CFDs) on gold, Brent and many more instruments. CFDs allow traders to try to benefit from the upside and bear markets as well as the use of leverage. Click on the banner below to open an account today:
Did you know that you can use the Trading Central Technical Ideas Lookup indicator to find actionable trading ideas on thousands of different markets?
Start your free download by clicking on the banner below:
INFORMATION ABOUT ANALYTICAL MATERIALS:
The given data provides additional information regarding all analysis, estimates, prognosis, forecasts, market reviews, weekly outlooks or other similar assessments or information (hereinafter “Analysis”) published on the websites of Admiral Markets investment firms operating under the Admiral Markets trademark (hereinafter “Admiral Markets”) Before making any investment decisions please pay close attention to the following:
- This is a marketing communication. The content is published for informative purposes only and is in no way to be construed as investment advice or recommendation. It has not been prepared in accordance with legal requirements designed to promote the independence of investment research, and that it is not subject to any prohibition on dealing ahead of the dissemination of investment research.
- Any investment decision is made by each client alone whereas Admiral Markets shall not be responsible for any loss or damage arising from any such decision, whether or not based on the content.
- With view to protecting the interests of our clients and the objectivity of the Analysis, Admiral Markets has established relevant internal procedures for prevention and management of conflicts of interest.
- The Analysis is prepared by an independent analyst, Roberto Rojas (analyst), (hereinafter “Author”) based on their personal estimations.
- Whilst every reasonable effort is taken to ensure that all sources of the content are reliable and that all information is presented, as much as possible, in an understandable, timely, precise and complete manner, Admiral Markets does not guarantee the accuracy or completeness of any information contained within the Analysis.
- Any kind of past or modeled performance of financial instruments indicated within the content should not be construed as an express or implied promise, guarantee or implication by Admiral Markets for any future performance. The value of the financial instrument may both increase and decrease and the preservation of the asset value is not guaranteed.
- Leveraged products (including contracts for difference) are speculative in nature and may result in losses or profit. Before you start trading, please ensure that you fully understand the risks involved.

- COT Metals Charts: Weekly Speculator Bets led by Copper & Steel Jul 18, 2026
- COT Bonds Charts: Weekly Speculator Bets led by 2-Year, SOFR 3M & 5-Year Bonds Jul 18, 2026
- COT Energy Charts: Weekly Speculator Bets led by Brent Oil & Heating Oil Jul 18, 2026
- COT Soft Commodities Charts: Weekly Speculator Bets led by Wheat, Corn & Soybean Meal Jul 18, 2026
- The Bank of Canada kept its interest rate unchanged. Platinum prices reached a three‑week high Jul 16, 2026
- Stock indices rose after the release of US inflation data. China’s GDP slowed sharply Jul 15, 2026
- GBP/USD Awaits Political News: What Will Happen Next Jul 15, 2026
- USD/JPY Holds at Highs: Pressure Lingers on Yen Jul 14, 2026
- Oil prices jumped 4% amid a new wave of escalation between the US and Iran Jul 13, 2026
- EUR/USD: US Inflation Will Determine Everything Jul 13, 2026