
By CountingPips.com COT Home | Data Tables | Data Downloads | Newsletter
Here are the latest charts and statistics for the Commitment of Traders (COT) data published by the Commodities Futures Trading Commission (CFTC).
The latest COT data is updated through Tuesday July 06 2021 and shows a quick view of how large traders (for-profit speculators and commercial entities) were positioned in the futures markets.
VIX Volatility Futures:
 The VIX Volatility large speculator standing this week was a net position of -67,098 contracts in the data reported through Tuesday. This was a weekly decline of -407 contracts from the previous week which had a total of -66,691 net contracts.
This week’s current strength score (the trader positioning range over the past three years, measured from 0 to 100) shows the speculators are currently Bullish with a score of 57.6 percent. The commercials are Bearish with a score of 42.9 percent and the small traders (not shown in chart) are Bearish with a score of 38.9 percent.
| VIX Volatility Futures Statistics | SPECULATORS | COMMERCIALS | SMALL TRADERS |
| – Percent of Open Interest Longs: | 23.3 | 50.9 | 6.7 |
| – Percent of Open Interest Shorts: | 42.9 | 29.9 | 8.1 |
| – Net Position: | -67,098 | 71,711 | -4,613 |
| – Gross Longs: | 79,320 | 173,563 | 22,879 |
| – Gross Shorts: | 146,418 | 101,852 | 27,492 |
| – Long to Short Ratio: | 0.5 to 1 | 1.7 to 1 | 0.8 to 1 |
| NET POSITION TREND: | |||
| – COT Index Score (3 Year Range Pct): | 57.6 | 42.9 | 38.9 |
| – COT Index Reading (3 Year Range): | Bullish | Bearish | Bearish |
| NET POSITION MOVEMENT INDEX: | |||
| – 6-Week Change in Strength Index: | -2.3 | 1.4 | 9.0 |
Free Reports:
 Sign Up for Our Stock Market Newsletter – Get updated on News, Charts & Rankings of Public Companies when you join our Stocks Newsletter
 Get our Weekly Commitment of Traders Reports - See where the biggest traders (Hedge Funds and Commercial Hedgers) are positioned in the futures markets on a weekly basis.
S&P500 Mini Futures:
 The S&P500 Mini large speculator standing this week was a net position of 75,557 contracts in the data reported through Tuesday. This was a weekly rise of 20,390 contracts from the previous week which had a total of 55,167 net contracts.
This week’s current strength score (the trader positioning range over the past three years, measured from 0 to 100) shows the speculators are currently Bullish with a score of 66.9 percent. The commercials are Bearish with a score of 48.6 percent and the small traders (not shown in chart) are Bearish with a score of 30.8 percent.
| S&P500 Mini Futures Statistics | SPECULATORS | COMMERCIALS | SMALL TRADERS |
| – Percent of Open Interest Longs: | 15.4 | 72.0 | 10.4 |
| – Percent of Open Interest Shorts: | 12.5 | 75.7 | 9.5 |
| – Net Position: | 75,557 | -96,773 | 21,216 |
| – Gross Longs: | 403,183 | 1,878,439 | 270,515 |
| – Gross Shorts: | 327,626 | 1,975,212 | 249,299 |
| – Long to Short Ratio: | 1.2 to 1 | 1.0 to 1 | 1.1 to 1 |
| NET POSITION TREND: | |||
| – COT Index Score (3 Year Range Pct): | 66.9 | 48.6 | 30.8 |
| – COT Index Reading (3 Year Range): | Bullish | Bearish | Bearish |
| NET POSITION MOVEMENT INDEX: | |||
| – 6-Week Change in Strength Index: | 16.6 | 1.7 | -21.8 |
Dow Jones Mini Futures:
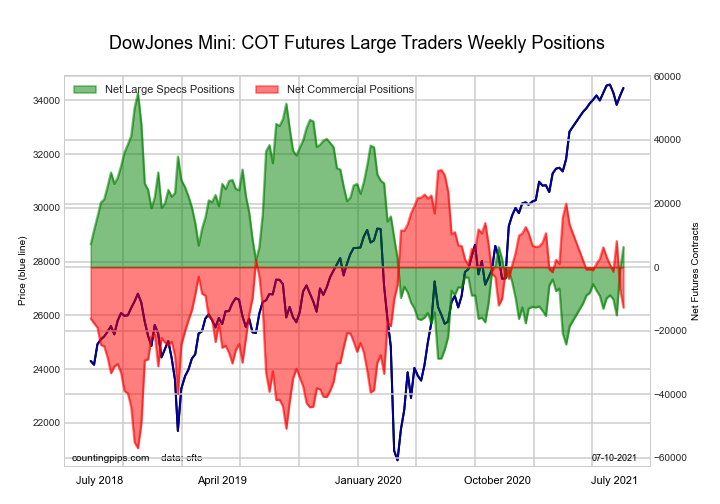 The Dow Jones Mini large speculator standing this week was a net position of 6,349 contracts in the data reported through Tuesday. This was a weekly rise of 7,174 contracts from the previous week which had a total of -825 net contracts.
This week’s current strength score (the trader positioning range over the past three years, measured from 0 to 100) shows the speculators are currently Bearish with a score of 42.0 percent. The commercials are Bullish with a score of 50.5 percent and the small traders (not shown in chart) are Bullish with a score of 72.5 percent.
| Dow Jones Mini Futures Statistics | SPECULATORS | COMMERCIALS | SMALL TRADERS |
| – Percent of Open Interest Longs: | 37.8 | 43.8 | 16.1 |
| – Percent of Open Interest Shorts: | 31.8 | 55.7 | 10.1 |
| – Net Position: | 6,349 | -12,705 | 6,356 |
| – Gross Longs: | 40,085 | 46,373 | 17,048 |
| – Gross Shorts: | 33,736 | 59,078 | 10,692 |
| – Long to Short Ratio: | 1.2 to 1 | 0.8 to 1 | 1.6 to 1 |
| NET POSITION TREND: | |||
| – COT Index Score (3 Year Range Pct): | 42.0 | 50.5 | 72.5 |
| – COT Index Reading (3 Year Range): | Bearish | Bullish | Bullish |
| NET POSITION MOVEMENT INDEX: | |||
| – 6-Week Change in Strength Index: | 23.2 | -21.7 | -2.3 |
Nasdaq Mini Futures:
 The Nasdaq Mini large speculator standing this week was a net position of -1,571 contracts in the data reported through Tuesday. This was a weekly advance of 6,528 contracts from the previous week which had a total of -8,099 net contracts.
This week’s current strength score (the trader positioning range over the past three years, measured from 0 to 100) shows the speculators are currently Bullish with a score of 74.2 percent. The commercials are Bearish with a score of 37.2 percent and the small traders (not shown in chart) are Bearish-Extreme with a score of 8.7 percent.
| Nasdaq Mini Futures Statistics | SPECULATORS | COMMERCIALS | SMALL TRADERS |
| – Percent of Open Interest Longs: | 28.8 | 55.1 | 14.4 |
| – Percent of Open Interest Shorts: | 29.5 | 47.5 | 21.3 |
| – Net Position: | -1,571 | 17,302 | -15,731 |
| – Gross Longs: | 65,755 | 125,742 | 32,891 |
| – Gross Shorts: | 67,326 | 108,440 | 48,622 |
| – Long to Short Ratio: | 1.0 to 1 | 1.2 to 1 | 0.7 to 1 |
| NET POSITION TREND: | |||
| – COT Index Score (3 Year Range Pct): | 74.2 | 37.2 | 8.7 |
| – COT Index Reading (3 Year Range): | Bullish | Bearish | Bearish-Extreme |
| NET POSITION MOVEMENT INDEX: | |||
| – 6-Week Change in Strength Index: | 6.5 | -3.1 | -15.0 |
Russell 2000 Mini Futures:
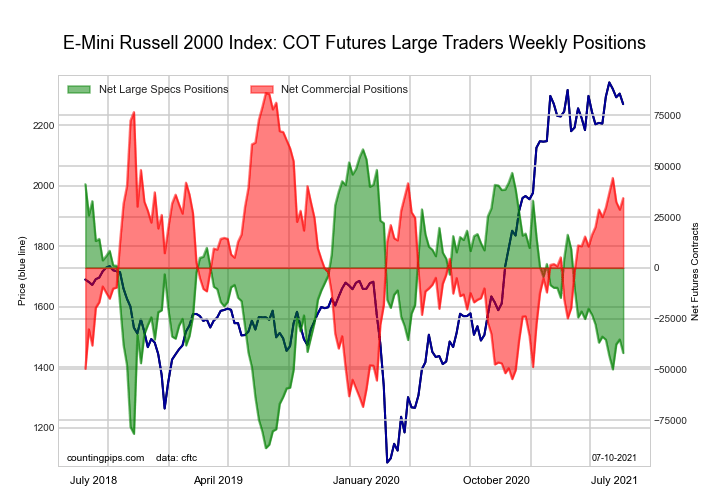 The Russell 2000 Mini large speculator standing this week was a net position of -41,907 contracts in the data reported through Tuesday. This was a weekly decline of -6,657 contracts from the previous week which had a total of -35,250 net contracts.
This week’s current strength score (the trader positioning range over the past three years, measured from 0 to 100) shows the speculators are currently Bearish with a score of 31.8 percent. The commercials are Bullish with a score of 66.5 percent and the small traders (not shown in chart) are Bullish with a score of 54.5 percent.
| Russell 2000 Mini Futures Statistics | SPECULATORS | COMMERCIALS | SMALL TRADERS |
| – Percent of Open Interest Longs: | 11.8 | 80.4 | 6.8 |
| – Percent of Open Interest Shorts: | 21.8 | 72.2 | 5.0 |
| – Net Position: | -41,907 | 34,318 | 7,589 |
| – Gross Longs: | 49,724 | 337,570 | 28,619 |
| – Gross Shorts: | 91,631 | 303,252 | 21,030 |
| – Long to Short Ratio: | 0.5 to 1 | 1.1 to 1 | 1.4 to 1 |
| NET POSITION TREND: | |||
| – COT Index Score (3 Year Range Pct): | 31.8 | 66.5 | 54.5 |
| – COT Index Reading (3 Year Range): | Bearish | Bullish | Bullish |
| NET POSITION MOVEMENT INDEX: | |||
| – 6-Week Change in Strength Index: | -5.5 | 6.1 | -3.7 |
Nikkei Stock Average (USD) Futures:
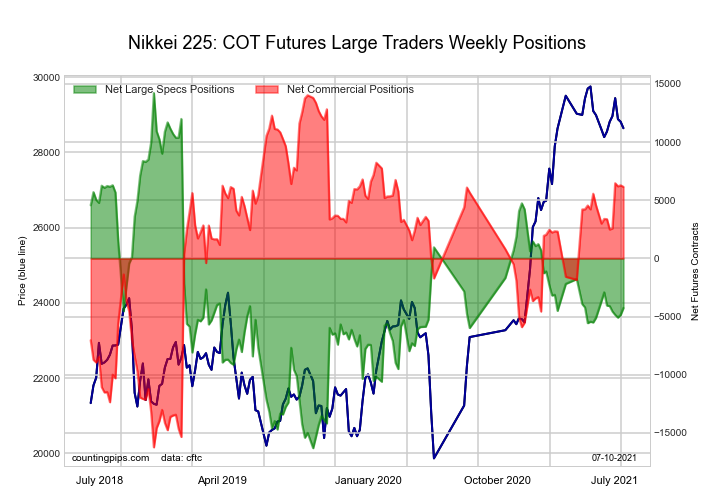 The Nikkei Stock Average (USD) large speculator standing this week was a net position of -4,253 contracts in the data reported through Tuesday. This was a weekly advance of 593 contracts from the previous week which had a total of -4,846 net contracts.
This week’s current strength score (the trader positioning range over the past three years, measured from 0 to 100) shows the speculators are currently Bearish with a score of 39.5 percent. The commercials are Bullish with a score of 74.0 percent and the small traders (not shown in chart) are Bearish-Extreme with a score of 0.0 percent.
| Nikkei Stock Average Futures Statistics | SPECULATORS | COMMERCIALS | SMALL TRADERS |
| – Percent of Open Interest Longs: | 19.0 | 59.0 | 21.9 |
| – Percent of Open Interest Shorts: | 44.4 | 22.3 | 33.3 |
| – Net Position: | -4,253 | 6,152 | -1,899 |
| – Gross Longs: | 3,181 | 9,895 | 3,677 |
| – Gross Shorts: | 7,434 | 3,743 | 5,576 |
| – Long to Short Ratio: | 0.4 to 1 | 2.6 to 1 | 0.7 to 1 |
| NET POSITION TREND: | |||
| – COT Index Score (3 Year Range Pct): | 39.5 | 74.0 | 0.0 |
| – COT Index Reading (3 Year Range): | Bearish | Bullish | Bearish-Extreme |
| NET POSITION MOVEMENT INDEX: | |||
| – 6-Week Change in Strength Index: | -0.7 | 9.2 | -29.3 |
MSCI EAFE Mini Futures:
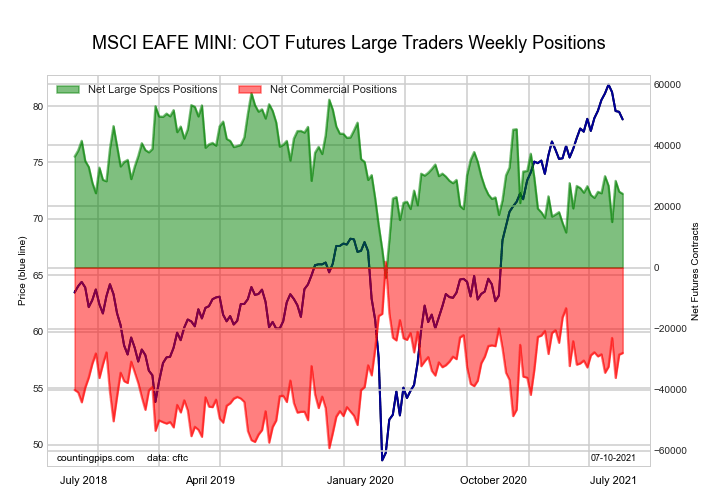 The MSCI EAFE Mini large speculator standing this week was a net position of 24,176 contracts in the data reported through Tuesday. This was a weekly decrease of -710 contracts from the previous week which had a total of 24,886 net contracts.
This week’s current strength score (the trader positioning range over the past three years, measured from 0 to 100) shows the speculators are currently Bearish with a score of 45.5 percent. The commercials are Bullish with a score of 51.1 percent and the small traders (not shown in chart) are Bullish with a score of 50.7 percent.
| MSCI EAFE Mini Futures Statistics | SPECULATORS | COMMERCIALS | SMALL TRADERS |
| – Percent of Open Interest Longs: | 8.9 | 88.3 | 2.6 |
| – Percent of Open Interest Shorts: | 3.2 | 94.9 | 1.7 |
| – Net Position: | 24,176 | -28,014 | 3,838 |
| – Gross Longs: | 37,584 | 374,464 | 10,875 |
| – Gross Shorts: | 13,408 | 402,478 | 7,037 |
| – Long to Short Ratio: | 2.8 to 1 | 0.9 to 1 | 1.5 to 1 |
| NET POSITION TREND: | |||
| – COT Index Score (3 Year Range Pct): | 45.5 | 51.1 | 50.7 |
| – COT Index Reading (3 Year Range): | Bearish | Bullish | Bullish |
| NET POSITION MOVEMENT INDEX: | |||
| – 6-Week Change in Strength Index: | -0.3 | 0.7 | -2.1 |
MSCI Emerging Mkts Mini Futures:
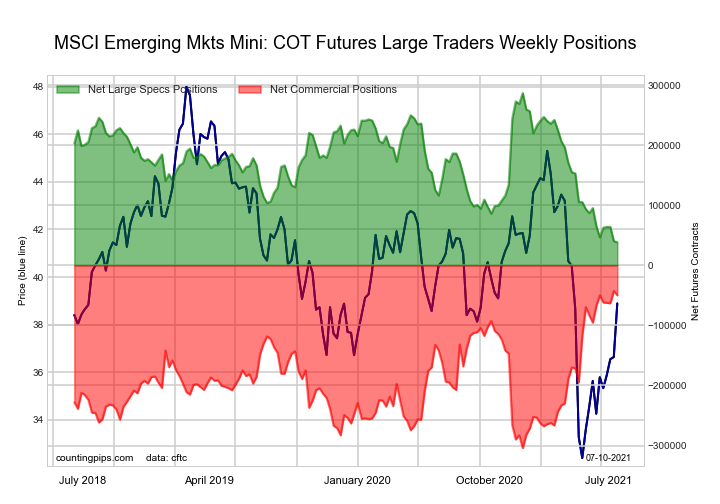 The MSCI Emerging Mkts Mini large speculator standing this week was a net position of 38,211 contracts in the data reported through Tuesday. This was a weekly reduction of -2,219 contracts from the previous week which had a total of 40,430 net contracts.
This week’s current strength score (the trader positioning range over the past three years, measured from 0 to 100) shows the speculators are currently Bearish-Extreme with a score of 0.0 percent. The commercials are Bullish-Extreme with a score of 97.2 percent and the small traders (not shown in chart) are Bearish with a score of 40.4 percent.
| MSCI Emerging Mkts Mini Futures Statistics | SPECULATORS | COMMERCIALS | SMALL TRADERS |
| – Percent of Open Interest Longs: | 14.3 | 82.2 | 2.4 |
| – Percent of Open Interest Shorts: | 11.0 | 86.5 | 1.3 |
| – Net Position: | 38,211 | -49,886 | 11,675 |
| – Gross Longs: | 165,150 | 950,685 | 27,250 |
| – Gross Shorts: | 126,939 | 1,000,571 | 15,575 |
| – Long to Short Ratio: | 1.3 to 1 | 1.0 to 1 | 1.7 to 1 |
| NET POSITION TREND: | |||
| – COT Index Score (3 Year Range Pct): | 0.0 | 97.2 | 40.4 |
| – COT Index Reading (3 Year Range): | Bearish-Extreme | Bullish-Extreme | Bearish |
| NET POSITION MOVEMENT INDEX: | |||
| – 6-Week Change in Strength Index: | -11.0 | 6.8 | 7.3 |
Article By CountingPips.com – Receive our weekly COT Reports by Email
*COT Report: The COT data, released weekly to the public each Friday, is updated through the most recent Tuesday (data is 3 days old) and shows a quick view of how large speculators or non-commercials (for-profit traders) were positioned in the futures markets.
The CFTC categorizes trader positions according to commercial hedgers (traders who use futures contracts for hedging as part of the business), non-commercials (large traders who speculate to realize trading profits) and nonreportable traders (usually small traders/speculators).
Find CFTC criteria here: (http://www.cftc.gov/MarketReports/CommitmentsofTraders/ExplanatoryNotes/index.htm).

- Investors run to safe-haven assets amid Middle East escalation Mar 6, 2026
- EUR/USD Under Pressure: Middle East Risks Outweigh All Else Mar 6, 2026
- Bitcoin shows resilience to Middle East events. Oil market stabilizes Mar 5, 2026
- GBP/USD: Market Not Expecting BoE Rate Cut in March Mar 5, 2026
- Brent headed for $100? Mar 4, 2026
- Global stock indices continue sell-off due to Middle East conflict Mar 4, 2026
- USD/JPY to Quickly Return to Growth: Momentum Favours the US Dollar Mar 4, 2026
- European equities plunge amid Persian Gulf military conflict Mar 3, 2026
- Gold Rallies for Fifth Day, With External Risks Mounting Mar 3, 2026
- Iran Crisis: A Dangerous Turning Point Mar 2, 2026