
By CountingPips.com COT Home | Data Tables | Data Downloads | Newsletter
Here are the latest charts and statistics for the Commitment of Traders (COT) data published by the Commodities Futures Trading Commission (CFTC).
The latest COT data is updated through Tuesday July 13 2021 and shows a quick view of how large traders (for-profit speculators and commercial entities) were positioned in the futures markets.
WTI Crude Oil Futures :
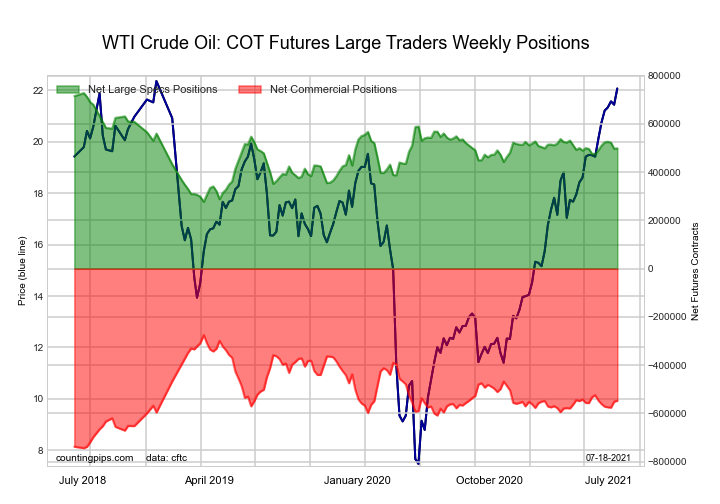 The WTI Crude Oil Futures large speculator standing this week resulted in a net position of 499,096 contracts in the data reported through Tuesday. This was a weekly increase of 1,745 contracts from the previous week which had a total of 497,351 net contracts.
This week’s current strength score (the trader positioning range over the past three years, measured from 0 to 100) shows the speculators are currently Bullish with a score of 66.0 percent. The commercials are Bearish with a score of 27.8 percent and the small traders (not shown in chart) are Bullish-Extreme with a score of 83.3 percent.
| WTI Crude Oil Futures Statistics | SPECULATORS | COMMERCIALS | SMALL TRADERS |
| – Percent of Open Interest Longs: | 26.4 | 34.0 | 4.5 |
| – Percent of Open Interest Shorts: | 5.7 | 56.7 | 2.5 |
| – Net Position: | 499,096 | -547,555 | 48,459 |
| – Gross Longs: | 636,318 | 819,975 | 108,781 |
| – Gross Shorts: | 137,222 | 1,367,530 | 60,322 |
| – Long to Short Ratio: | 4.6 to 1 | 0.6 to 1 | 1.8 to 1 |
| NET POSITION TREND: | |||
| – COT Index Score (3 Year Range Pct): | 66.0 | 27.8 | 83.3 |
| – COT Index Reading (3 Year Range): | Bullish | Bearish | Bullish-Extreme |
| NET POSITION MOVEMENT INDEX: | |||
| – 6-Week Change in Strength Index: | 2.3 | -0.3 | -9.6 |
Free Reports:
 Get our Weekly Commitment of Traders Reports - See where the biggest traders (Hedge Funds and Commercial Hedgers) are positioned in the futures markets on a weekly basis.
 Download Our Metatrader 4 Indicators – Put Our Free MetaTrader 4 Custom Indicators on your charts when you join our Weekly Newsletter
Brent Crude Oil Futures :
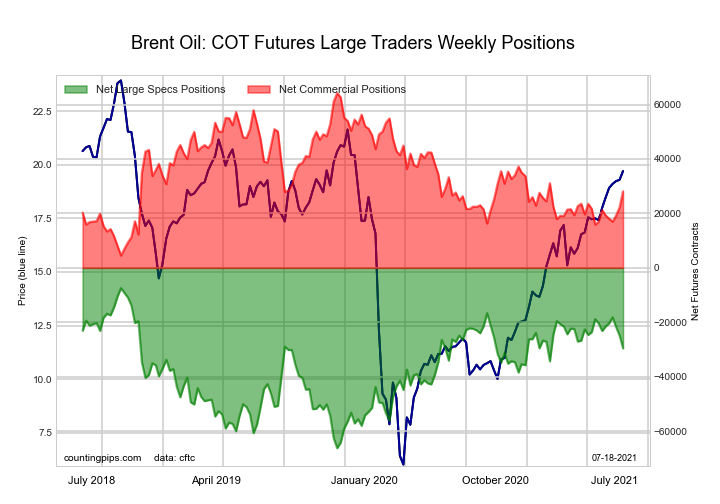 The Brent Crude Oil Futures large speculator standing this week resulted in a net position of -29,547 contracts in the data reported through Tuesday. This was a weekly reduction of -4,701 contracts from the previous week which had a total of -24,846 net contracts.
This week’s current strength score (the trader positioning range over the past three years, measured from 0 to 100) shows the speculators are currently Bullish with a score of 62.4 percent. The commercials are Bearish with a score of 39.5 percent and the small traders (not shown in chart) are Bearish with a score of 47.9 percent.
| Brent Crude Oil Futures Statistics | SPECULATORS | COMMERCIALS | SMALL TRADERS |
| – Percent of Open Interest Longs: | 17.7 | 54.8 | 4.6 |
| – Percent of Open Interest Shorts: | 32.9 | 40.3 | 3.9 |
| – Net Position: | -29,547 | 28,125 | 1,422 |
| – Gross Longs: | 34,315 | 106,223 | 8,921 |
| – Gross Shorts: | 63,862 | 78,098 | 7,499 |
| – Long to Short Ratio: | 0.5 to 1 | 1.4 to 1 | 1.2 to 1 |
| NET POSITION TREND: | |||
| – COT Index Score (3 Year Range Pct): | 62.4 | 39.5 | 47.9 |
| – COT Index Reading (3 Year Range): | Bullish | Bearish | Bearish |
| NET POSITION MOVEMENT INDEX: | |||
| – 6-Week Change in Strength Index: | -10.8 | 11.6 | -4.7 |
Natural Gas Futures :
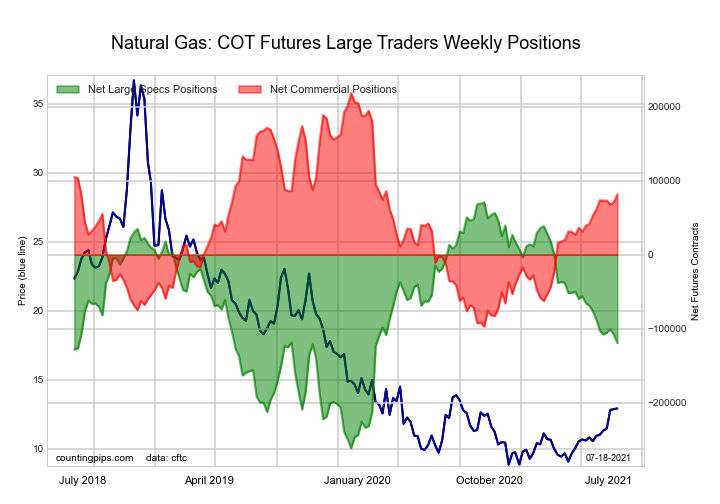 The Natural Gas Futures large speculator standing this week resulted in a net position of -119,404 contracts in the data reported through Tuesday. This was a weekly reduction of -11,350 contracts from the previous week which had a total of -108,054 net contracts.
This week’s current strength score (the trader positioning range over the past three years, measured from 0 to 100) shows the speculators are currently Bearish with a score of 42.7 percent. The commercials are Bullish with a score of 56.6 percent and the small traders (not shown in chart) are Bullish with a score of 67.6 percent.
| Natural Gas Futures Statistics | SPECULATORS | COMMERCIALS | SMALL TRADERS |
| – Percent of Open Interest Longs: | 24.4 | 40.5 | 4.3 |
| – Percent of Open Interest Shorts: | 32.6 | 34.9 | 1.7 |
| – Net Position: | -119,404 | 81,780 | 37,624 |
| – Gross Longs: | 355,814 | 590,815 | 62,749 |
| – Gross Shorts: | 475,218 | 509,035 | 25,125 |
| – Long to Short Ratio: | 0.7 to 1 | 1.2 to 1 | 2.5 to 1 |
| NET POSITION TREND: | |||
| – COT Index Score (3 Year Range Pct): | 42.7 | 56.6 | 67.6 |
| – COT Index Reading (3 Year Range): | Bearish | Bullish | Bullish |
| NET POSITION MOVEMENT INDEX: | |||
| – 6-Week Change in Strength Index: | -9.6 | 6.4 | 37.5 |
Gasoline Blendstock Futures :
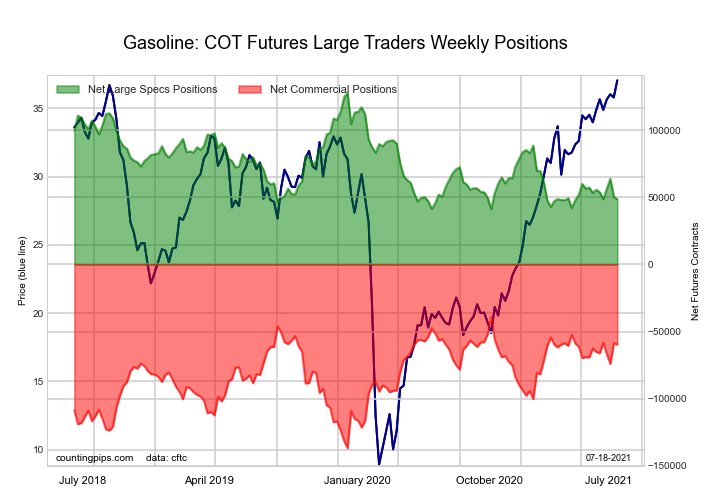 The Gasoline Blendstock Futures large speculator standing this week resulted in a net position of 48,570 contracts in the data reported through Tuesday. This was a weekly decrease of -1,847 contracts from the previous week which had a total of 50,417 net contracts.
This week’s current strength score (the trader positioning range over the past three years, measured from 0 to 100) shows the speculators are currently Bearish-Extreme with a score of 8.6 percent. The commercials are Bullish with a score of 79.2 percent and the small traders (not shown in chart) are Bullish with a score of 77.2 percent.
| Nasdaq Mini Futures Statistics | SPECULATORS | COMMERCIALS | SMALL TRADERS |
| – Percent of Open Interest Longs: | 25.6 | 46.4 | 6.7 |
| – Percent of Open Interest Shorts: | 12.3 | 62.7 | 3.7 |
| – Net Position: | 48,570 | -59,550 | 10,980 |
| – Gross Longs: | 93,548 | 169,716 | 24,492 |
| – Gross Shorts: | 44,978 | 229,266 | 13,512 |
| – Long to Short Ratio: | 2.1 to 1 | 0.7 to 1 | 1.8 to 1 |
| NET POSITION TREND: | |||
| – COT Index Score (3 Year Range Pct): | 8.6 | 79.2 | 77.2 |
| – COT Index Reading (3 Year Range): | Bearish-Extreme | Bullish | Bullish |
| NET POSITION MOVEMENT INDEX: | |||
| – 6-Week Change in Strength Index: | -8.2 | 5.8 | 8.7 |
#2 Heating Oil NY-Harbor Futures :
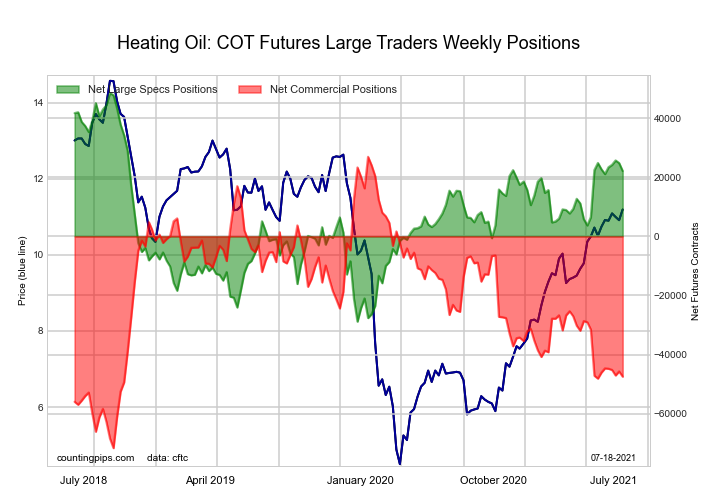 The #2 Heating Oil NY-Harbor Futures large speculator standing this week resulted in a net position of 22,140 contracts in the data reported through Tuesday. This was a weekly lowering of -2,681 contracts from the previous week which had a total of 24,821 net contracts.
This week’s current strength score (the trader positioning range over the past three years, measured from 0 to 100) shows the speculators are currently Bullish with a score of 65.9 percent. The commercials are Bearish with a score of 24.5 percent and the small traders (not shown in chart) are Bullish-Extreme with a score of 99.9 percent.
| Heating Oil Futures Statistics | SPECULATORS | COMMERCIALS | SMALL TRADERS |
| – Percent of Open Interest Longs: | 15.7 | 50.3 | 11.4 |
| – Percent of Open Interest Shorts: | 10.4 | 61.7 | 5.4 |
| – Net Position: | 22,140 | -47,473 | 25,333 |
| – Gross Longs: | 65,362 | 209,536 | 47,696 |
| – Gross Shorts: | 43,222 | 257,009 | 22,363 |
| – Long to Short Ratio: | 1.5 to 1 | 0.8 to 1 | 2.1 to 1 |
| NET POSITION TREND: | |||
| – COT Index Score (3 Year Range Pct): | 65.9 | 24.5 | 99.9 |
| – COT Index Reading (3 Year Range): | Bullish | Bearish | Bullish-Extreme |
| NET POSITION MOVEMENT INDEX: | |||
| – 6-Week Change in Strength Index: | -0.7 | -1.4 | 7.8 |
Bloomberg Commodity Index Futures :
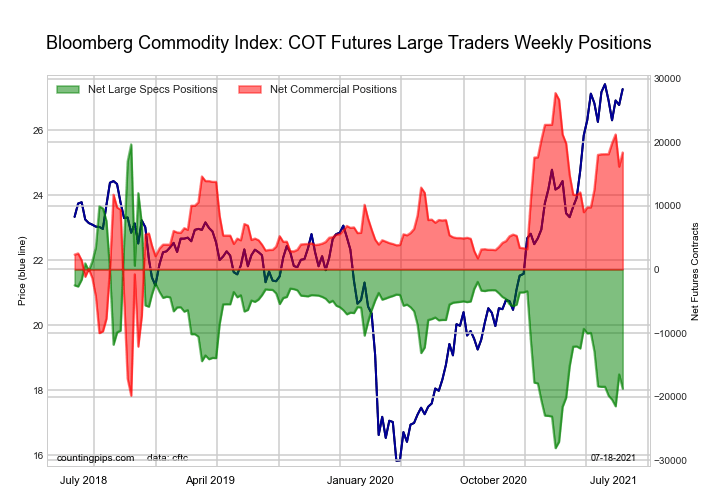 The Bloomberg Commodity Index Futures large speculator standing this week resulted in a net position of -18,762 contracts in the data reported through Tuesday. This was a weekly lowering of -2,249 contracts from the previous week which had a total of -16,513 net contracts.
This week’s current strength score (the trader positioning range over the past three years, measured from 0 to 100) shows the speculators are currently Bearish-Extreme with a score of 19.6 percent. The commercials are Bullish-Extreme with a score of 80.4 percent and the small traders (not shown in chart) are Bearish with a score of 40.0 percent.
| Bloomberg Index Futures Statistics | SPECULATORS | COMMERCIALS | SMALL TRADERS |
| – Percent of Open Interest Longs: | 45.0 | 53.4 | 1.1 |
| – Percent of Open Interest Shorts: | 91.0 | 8.3 | 0.3 |
| – Net Position: | -18,762 | 18,404 | 358 |
| – Gross Longs: | 18,363 | 21,804 | 469 |
| – Gross Shorts: | 37,125 | 3,400 | 111 |
| – Long to Short Ratio: | 0.5 to 1 | 6.4 to 1 | 4.2 to 1 |
| NET POSITION TREND: | |||
| – COT Index Score (3 Year Range Pct): | 19.6 | 80.4 | 40.0 |
| – COT Index Reading (3 Year Range): | Bearish-Extreme | Bullish-Extreme | Bearish |
| NET POSITION MOVEMENT INDEX: | |||
| – 6-Week Change in Strength Index: | -0.6 | 0.6 | 0.7 |
Article By CountingPips.com – Receive our weekly COT Reports by Email
*COT Report: The COT data, released weekly to the public each Friday, is updated through the most recent Tuesday (data is 3 days old) and shows a quick view of how large speculators or non-commercials (for-profit traders) were positioned in the futures markets.
The CFTC categorizes trader positions according to commercial hedgers (traders who use futures contracts for hedging as part of the business), non-commercials (large traders who speculate to realize trading profits) and nonreportable traders (usually small traders/speculators).
Find CFTC criteria here: (http://www.cftc.gov/MarketReports/CommitmentsofTraders/ExplanatoryNotes/index.htm).

- COT Metals Charts: Speculator Bets led by Silver, Gold & Platinum Mar 7, 2026
- COT Bonds Charts: Speculator Bets led by 10-Year Bonds & Fed Funds Mar 7, 2026
- COT Energy Charts: Speculator Bets led by Brent Oil & Heating Oil Mar 7, 2026
- COT Soft Commodities Charts: Speculator Bets led by Corn & Soybean Meal Mar 7, 2026
- Investors run to safe-haven assets amid Middle East escalation Mar 6, 2026
- EUR/USD Under Pressure: Middle East Risks Outweigh All Else Mar 6, 2026
- Bitcoin shows resilience to Middle East events. Oil market stabilizes Mar 5, 2026
- GBP/USD: Market Not Expecting BoE Rate Cut in March Mar 5, 2026
- Brent headed for $100? Mar 4, 2026
- Global stock indices continue sell-off due to Middle East conflict Mar 4, 2026