
By Orbex
USDJPY enters supply area

The US dollar struggles to bounce higher as high inflation seems temporary.
The previous sell-off below the demand area near 109.80 has spoiled the recovery mood. The former support has turned into a resistance and so far capped the greenback’s advance.
The pair is in horizontal consolidation while the RSI returns to neutral conditions.
110.30 would be the next hurdle if the price action turns around. A fall below 109.20 could trigger another round of sell-off towards 108.60, a major support on the daily chart.
Free Reports:
 Sign Up for Our Stock Market Newsletter – Get updated on News, Charts & Rankings of Public Companies when you join our Stocks Newsletter
 Get our Weekly Commitment of Traders Reports - See where the biggest traders (Hedge Funds and Commercial Hedgers) are positioned in the futures markets on a weekly basis.
NZDUSD capped by falling trendline
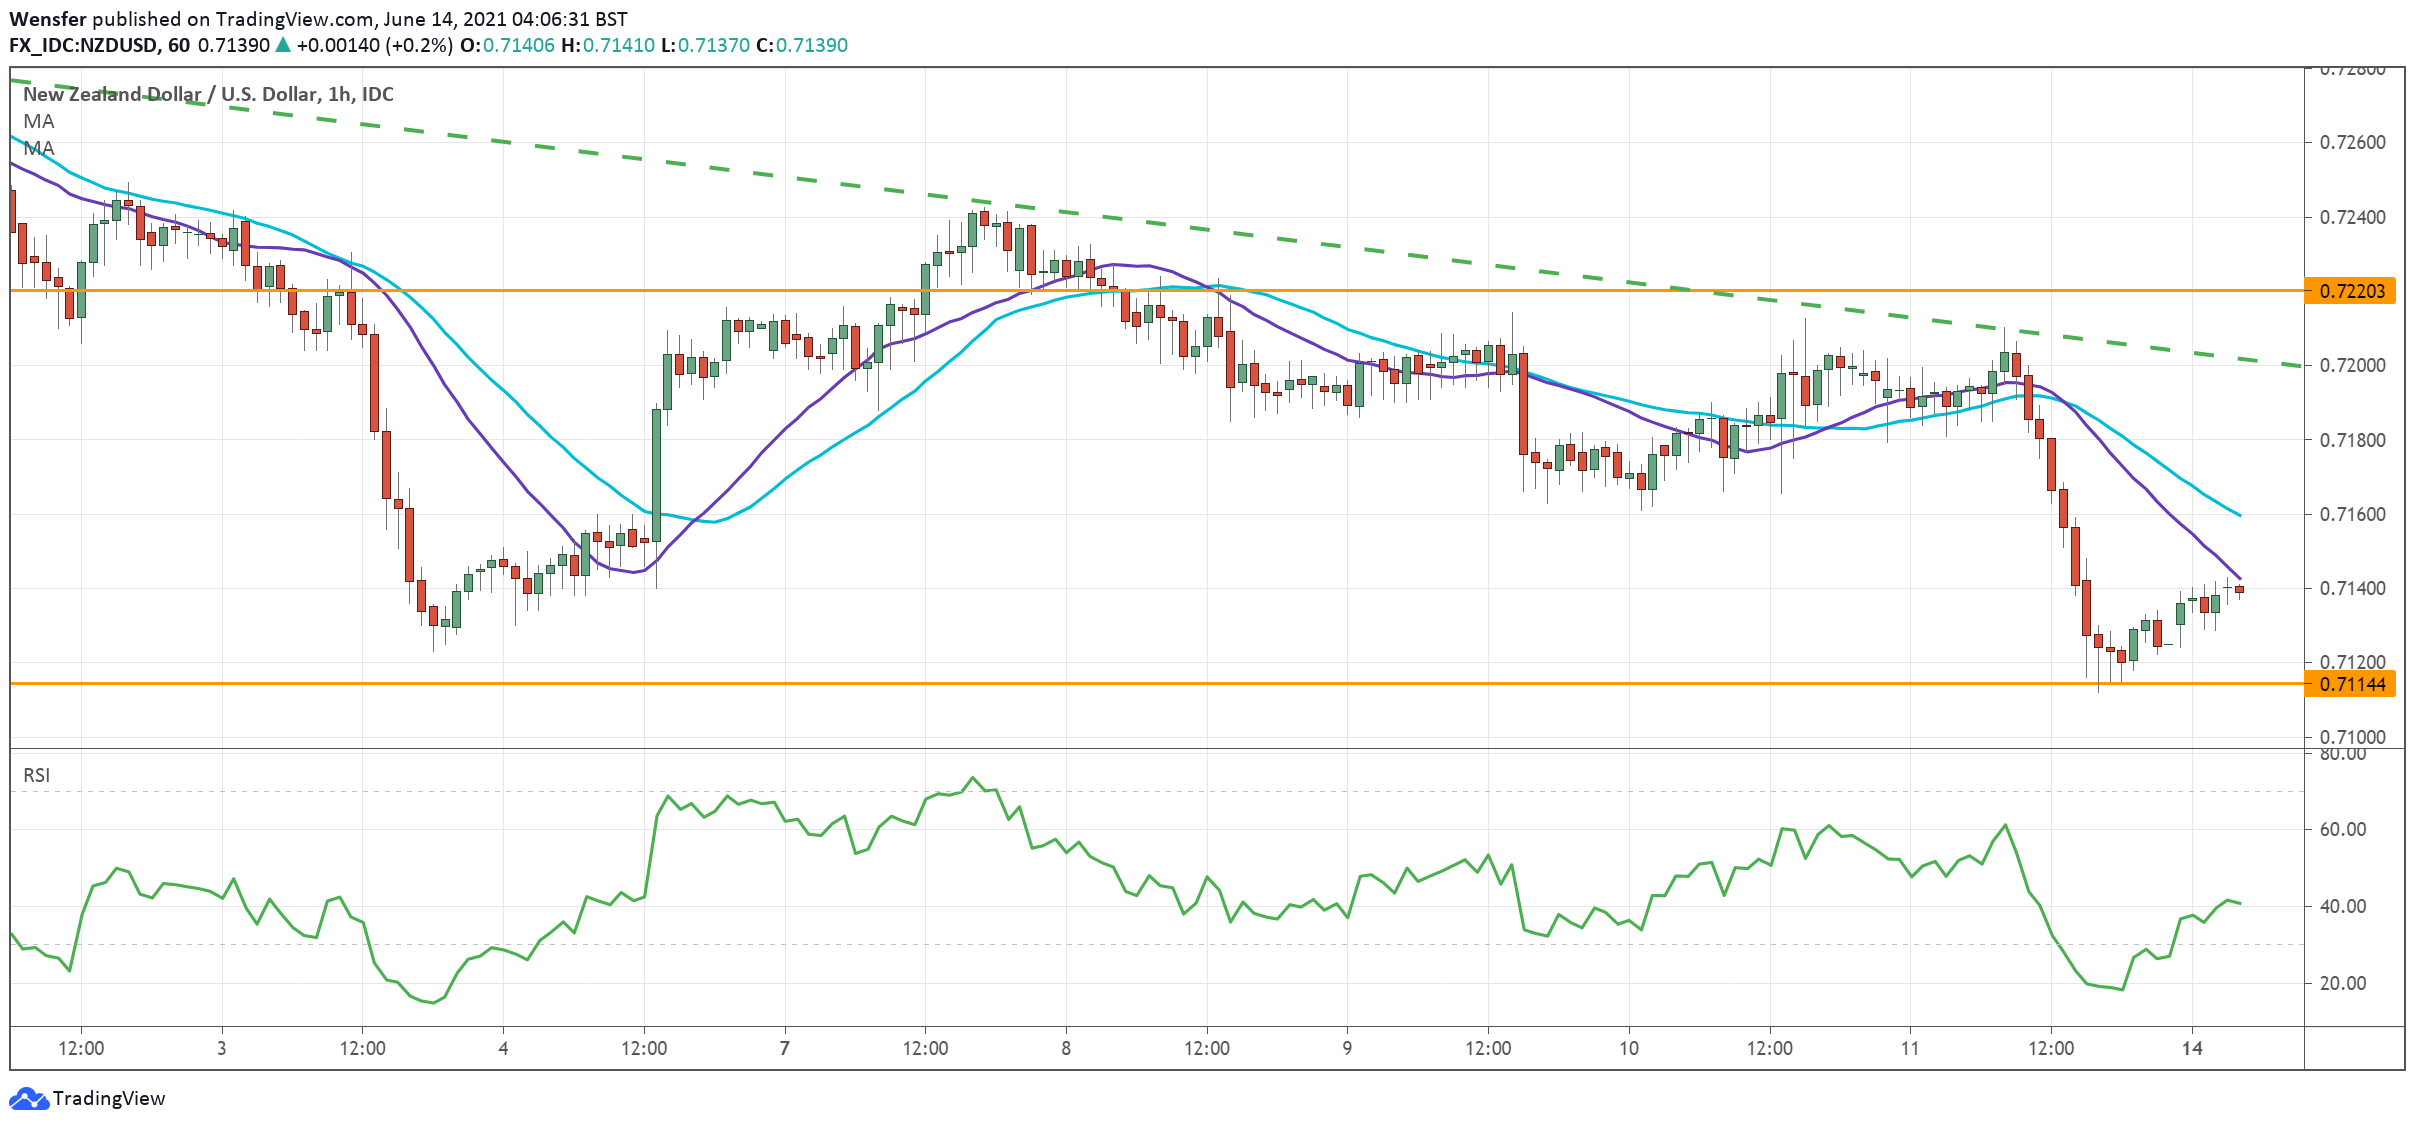
The New Zealand dollar sees profit-taking in anticipation of this week’s FOMC.
The pair has been in extended consolidation after it broke above the daily resistance at 0.7300. The descending trendline indicates increasing selling pressure.
The kiwi has a well-established demand zone around 0.7115, a key support from the daily chart. As the RSI rises back from an oversold situation, buying interest could push the pair towards the trendline (0.7180).
The ten-week-long rally may resume only if the price breaks out.
US 30 consolidates gains
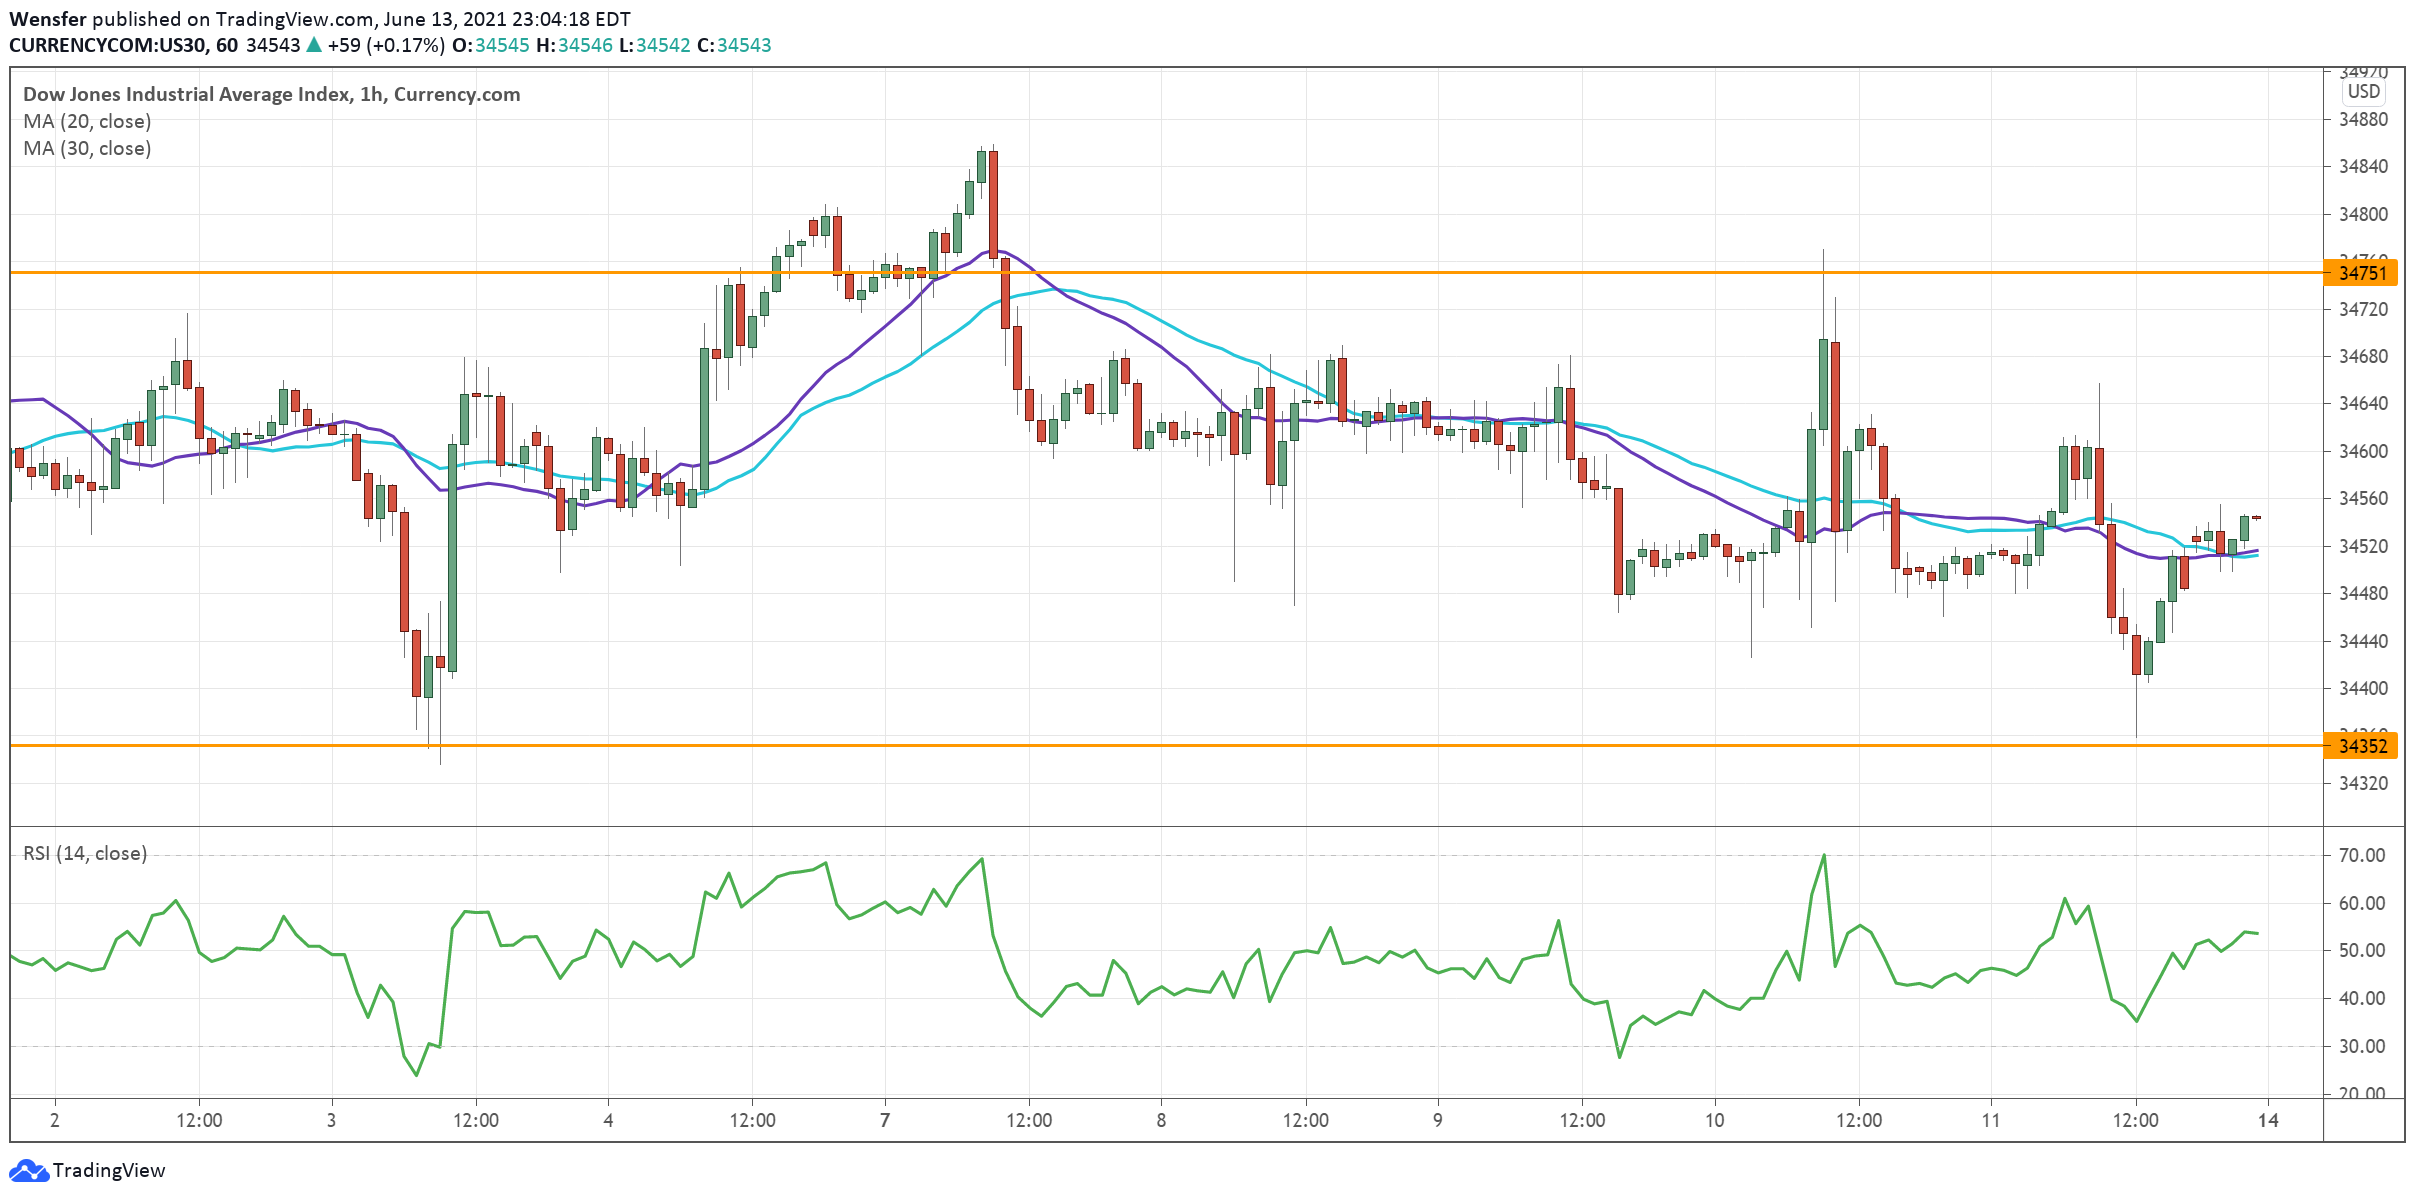
The Dow Jones Industrial Average rallies as the recovery goes in full swing in the US.
The latest whipsaw barely dented investors’ faith. The index has recouped most of the losses from the May sell-off. Buyers have been building their stakes above the 30-day moving average (34350). 34750 is the key resistance intraday, its breach may send the price action to the peak at 35100.
On the downside, a deeper correction would test the critical demand area between 33500 and 33700 from the daily chart.
By Orbex

- COT Metals Charts: Speculator Bets led by Silver, Gold & Platinum Mar 7, 2026
- COT Bonds Charts: Speculator Bets led by 10-Year Bonds & Fed Funds Mar 7, 2026
- COT Energy Charts: Speculator Bets led by Brent Oil & Heating Oil Mar 7, 2026
- COT Soft Commodities Charts: Speculator Bets led by Corn & Soybean Meal Mar 7, 2026
- Investors run to safe-haven assets amid Middle East escalation Mar 6, 2026
- EUR/USD Under Pressure: Middle East Risks Outweigh All Else Mar 6, 2026
- Bitcoin shows resilience to Middle East events. Oil market stabilizes Mar 5, 2026
- GBP/USD: Market Not Expecting BoE Rate Cut in March Mar 5, 2026
- Brent headed for $100? Mar 4, 2026
- Global stock indices continue sell-off due to Middle East conflict Mar 4, 2026